The graph of y = f(x) is shown in blue. Draw the graph of y=f(x), shown in red, by determining how a stretch or compression will transform the location of the indicated blue points. Drag the movable red points to the desired coordinates. You may click on a point to verify its coordinates. Provide your answer below:
The graph of y = f(x) is shown in blue. Draw the graph of y=f(x), shown in red, by determining how a stretch or compression will transform the location of the indicated blue points. Drag the movable red points to the desired coordinates. You may click on a point to verify its coordinates. Provide your answer below:

Algebra & Trigonometry with Analytic Geometry
13th Edition
ISBN:9781133382119
Author:Swokowski
Publisher:Swokowski
Chapter3: Functions And Graphs
Section: Chapter Questions
Problem 1DE

Related questions
Question
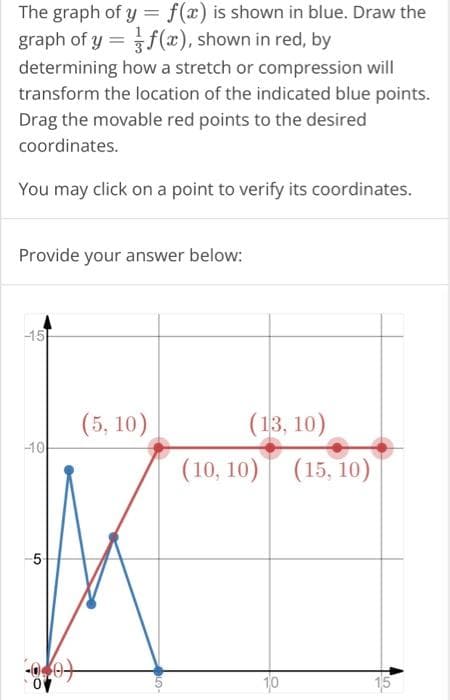
Transcribed Image Text:The graph of y = f(x) is shown in blue. Draw the
graph of y=f(x), shown in red, by
determining how a stretch or compression will
transform the location of the indicated blue points.
Drag the movable red points to the desired
coordinates.
You may click on a point to verify its coordinates.
Provide your answer below:
-15
-10
-5-
00
0
(5, 10)
(13, 10)
(10, 10) (15, 10)
10
5
Expert Solution
This question has been solved!
Explore an expertly crafted, step-by-step solution for a thorough understanding of key concepts.

This is a popular solution!

Trending now
This is a popular solution!

Step by step
Solved in 2 steps with 2 images

Recommended textbooks for you
Algebra & Trigonometry with Analytic Geometry
Algebra
ISBN:
9781133382119
Author:
Swokowski
Publisher:
Cengage
Algebra & Trigonometry with Analytic Geometry
Algebra
ISBN:
9781133382119
Author:
Swokowski
Publisher:
Cengage