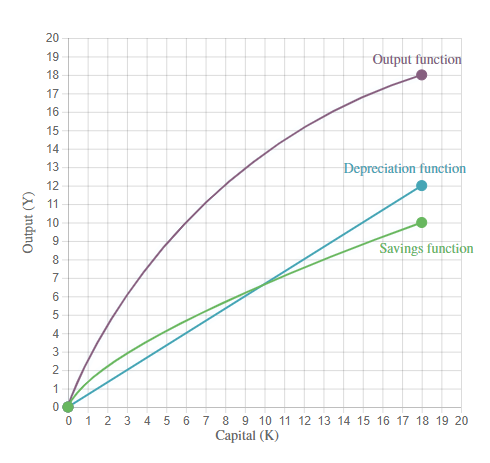
The graph shows the output function, savings function, and depreciation function for an economy. Show what happens when the investment rate decreases by half by shifting the appropriate curve or curves in the graph.
The graph shows the output function, savings function, and depreciation function for an economy. Show what happens when the investment rate decreases by half by shifting the appropriate curve or curves in the graph.

Managerial Economics: Applications, Strategies and Tactics (MindTap Course List)
14th Edition
ISBN:9781305506381
Author:James R. McGuigan, R. Charles Moyer, Frederick H.deB. Harris
Publisher:James R. McGuigan, R. Charles Moyer, Frederick H.deB. Harris
Chapter9: Applications Of Cost Theory
Section: Chapter Questions
Problem 1.8CE

Related questions
Question
The graph shows the output function, savings function, and
Transcribed Image Text:20
19
Output function
18
17
16
15
14
13
Depreciation function
12
E 11
10
9
Savings function
7
6
4
3.
2
0 1 2 3 4 5 6 7 8 9 10 11 12 13 14 15 16 17 18 19 20
Capital (K)
Output (Y)
Expert Solution
This question has been solved!
Explore an expertly crafted, step-by-step solution for a thorough understanding of key concepts.

This is a popular solution!

Trending now
This is a popular solution!

Step by step
Solved in 2 steps with 1 images

Knowledge Booster


Learn more about
Need a deep-dive on the concept behind this application? Look no further. Learn more about this topic, economics and related others by exploring similar questions and additional content below.Recommended textbooks for you
Managerial Economics: Applications, Strategies an…
Economics
ISBN:
9781305506381
Author:
James R. McGuigan, R. Charles Moyer, Frederick H.deB. Harris
Publisher:
Cengage Learning
Managerial Economics: Applications, Strategies an…
Economics
ISBN:
9781305506381
Author:
James R. McGuigan, R. Charles Moyer, Frederick H.deB. Harris
Publisher:
Cengage Learning