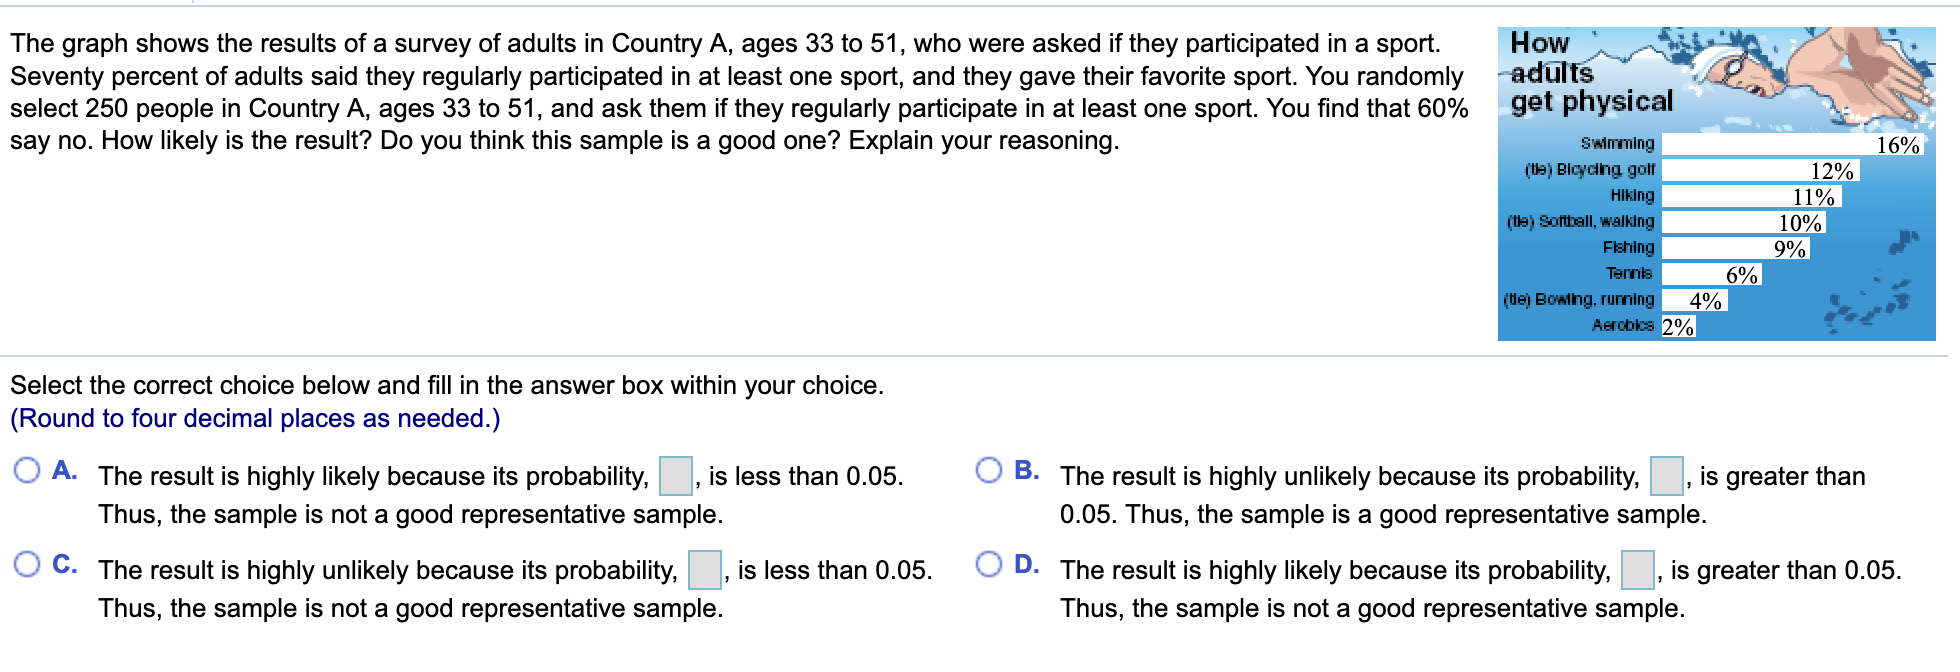
The graph shows the results of a survey of adults in Country A, ages 33 to 51, who were asked if they participated in a sport Seventy percent of adults said they regularly participated in at least one sport, and they gave their favorite sport. You randomly select 250 people in Country A, ages 33 to 51, and ask them if they regularly participate in at least one sport. You find that 60% say no. How likely is the result? Do you think this sample is a good one? Explain your reasoning. How adults get physical Swimming 16% 12% 11% (te) Bicycling golf HIking (te) Softball, wal king 10% 9% Flshing 6% 4% Aerobks 2% Tennis (ie) Bowling, runing Select the correct choice below and fill in the answer box within your choice. (Round to four decimal places as needed.) A. The result is highly likely because its probability, B. The result is highly unlikely because its probability, 0.05. Thus, the sample is a good representative sample. is less than 0.05 is greater than Thus, the sample is not a good representative sample. C. The result is highly unlikely because its probability, D. The result is highly likely because its probability, is less than 0.05 is greater than 0.05 Thus, the sample is not a good representative sample. Thus, the sample is not a good representative sample.


Contingency Table
A contingency table can be defined as the visual representation of the relationship between two or more categorical variables that can be evaluated and registered. It is a categorical version of the scatterplot, which is used to investigate the linear relationship between two variables. A contingency table is indeed a type of frequency distribution table that displays two variables at the same time.
Binomial Distribution
Binomial is an algebraic expression of the sum or the difference of two terms. Before knowing about binomial distribution, we must know about the binomial theorem.
I don't understand how to use binomial formulas to solve this problem


Trending now
This is a popular solution!

Step by step
Solved in 3 steps with 1 images


