The graphs illustrate an initial equilibrium for the economy. Suppose that the stock market broadly decreases. Use the graphs to show the new positions of aggregate demand (AD), short-run aggregate supply (SRAS), and long-run aggregate supply (LRAS) in both the short run and the long run, as well as the short-run and long-run equilibriums resulting from this change. Then, indicate what happens to the price level and GDP in the short run and in the long run. Short-run graph Long-run graph LRAS LRAS SRAS SRAS Short-ryn equilibrium Long-run equilibrium AD AD Real GDP Real GDP Aggregate price level Aggregate price level
The graphs illustrate an initial equilibrium for the economy. Suppose that the stock market broadly decreases. Use the graphs to show the new positions of aggregate demand (AD), short-run aggregate supply (SRAS), and long-run aggregate supply (LRAS) in both the short run and the long run, as well as the short-run and long-run equilibriums resulting from this change. Then, indicate what happens to the price level and GDP in the short run and in the long run. Short-run graph Long-run graph LRAS LRAS SRAS SRAS Short-ryn equilibrium Long-run equilibrium AD AD Real GDP Real GDP Aggregate price level Aggregate price level

Chapter10: Income And Expenditures Equilibrium
Section: Chapter Questions
Problem 17E

Related questions
Question
how should I answer this ?
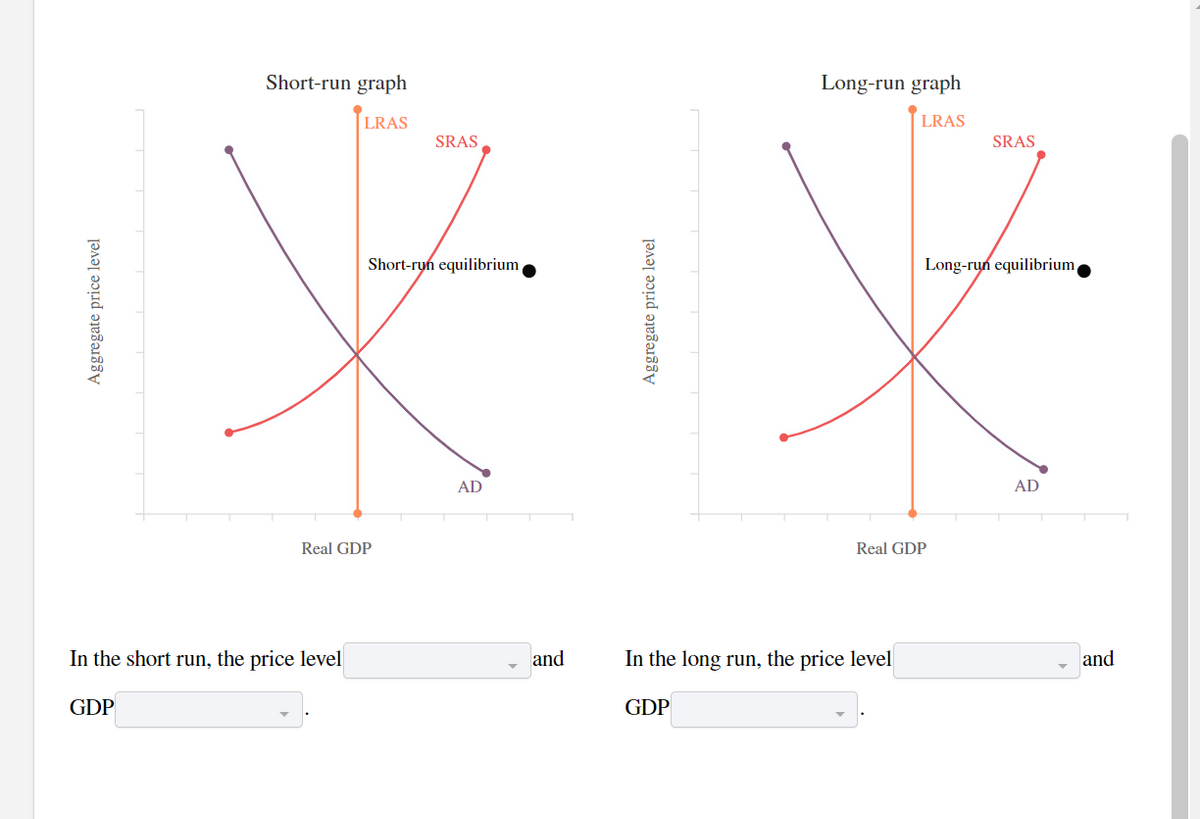
Transcribed Image Text:Short-run graph
Long-run graph
LRAS
LRAS
SRAS
SRAS
Short-run equilibrium
Long-run equilibrium
AD
AD
Real GDP
Real GDP
In the short run, the price level
- and
In the long run, the price level
and
GDP
GDP
Aggregate price level
Aggregate price level
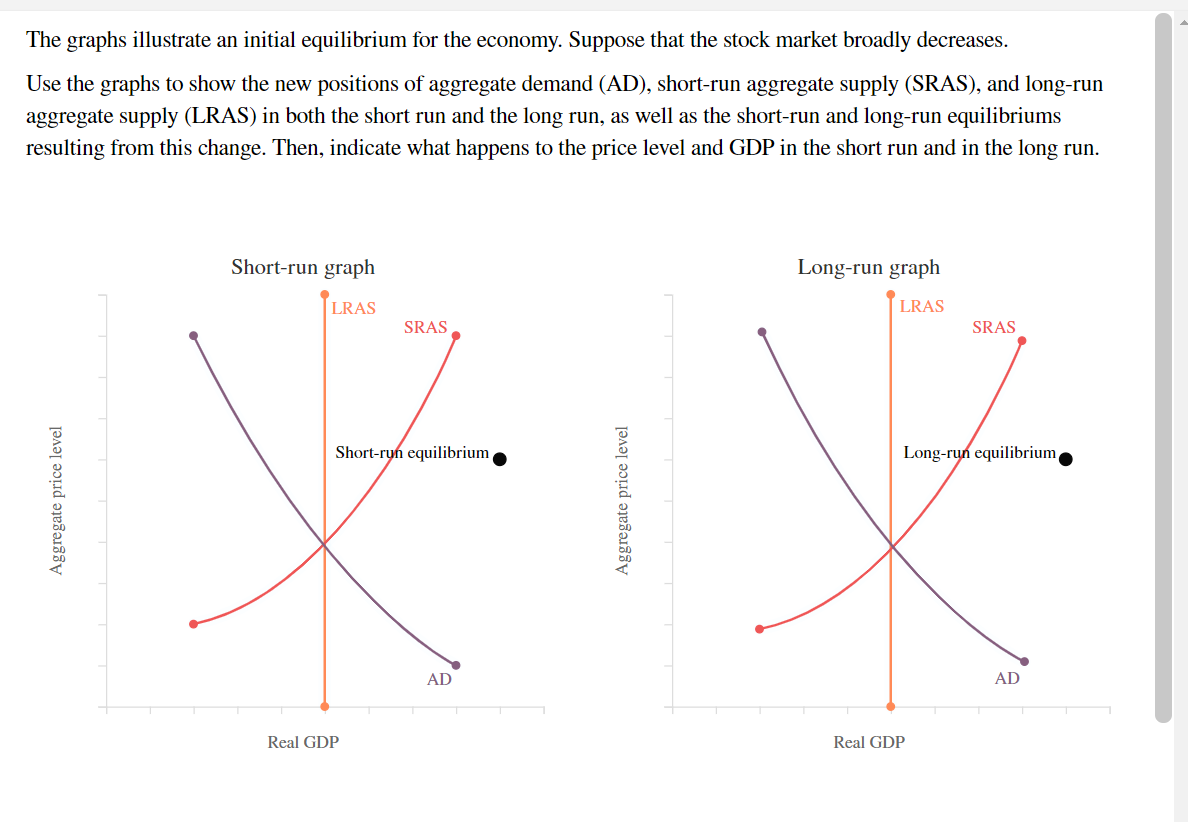
Transcribed Image Text:The graphs illustrate an initial equilibrium for the economy. Suppose that the stock market broadly decreases.
Use the graphs to show the new positions of aggregate demand (AD), short-run aggregate supply (SRAS), and long-run
aggregate supply (LRAS) in both the short run and the long run, as well as the short-run and long-run equilibriums
resulting from this change. Then, indicate what happens to the price level and GDP in the short run and in the long run.
Short-run graph
Long-run graph
LRAS
LRAS
SRAS
SRAS
Short-ryn equilibrium
Long-run equilibrium
AD
AD
Real GDP
Real GDP
Aggregate price level
Aggregate price level
Expert Solution
This question has been solved!
Explore an expertly crafted, step-by-step solution for a thorough understanding of key concepts.

This is a popular solution!

Trending now
This is a popular solution!

Step by step
Solved in 2 steps with 1 images

Knowledge Booster


Learn more about
Need a deep-dive on the concept behind this application? Look no further. Learn more about this topic, economics and related others by exploring similar questions and additional content below.Recommended textbooks for you

Economics: Private and Public Choice (MindTap Cou…
Economics
ISBN:
9781305506725
Author:
James D. Gwartney, Richard L. Stroup, Russell S. Sobel, David A. Macpherson
Publisher:
Cengage Learning

Macroeconomics: Private and Public Choice (MindTa…
Economics
ISBN:
9781305506756
Author:
James D. Gwartney, Richard L. Stroup, Russell S. Sobel, David A. Macpherson
Publisher:
Cengage Learning
Economics: Private and Public Choice (MindTap Cou…
Economics
ISBN:
9781305506725
Author:
James D. Gwartney, Richard L. Stroup, Russell S. Sobel, David A. Macpherson
Publisher:
Cengage Learning
Macroeconomics: Private and Public Choice (MindTa…
Economics
ISBN:
9781305506756
Author:
James D. Gwartney, Richard L. Stroup, Russell S. Sobel, David A. Macpherson
Publisher:
Cengage Learning

Exploring Economics
Economics
ISBN:
9781544336329
Author:
Robert L. Sexton
Publisher:
SAGE Publications, Inc

