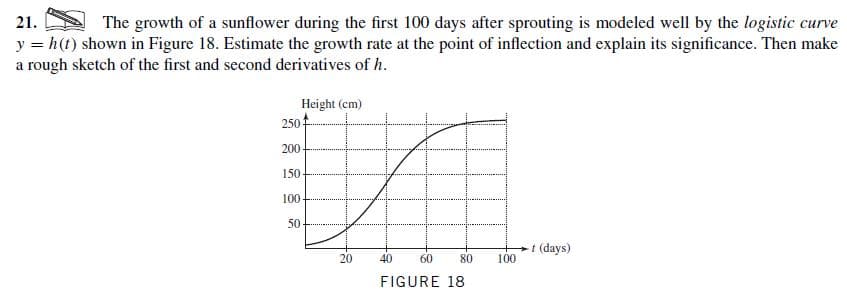
The growth of a sunflower during the first 100 days after sprouting is modeled well by the logistic curve 21. y = h(t) shown in Figure 18. Estimate the growth rate at the point of inflection and explain its significance. Then make a rough sketch of the first and second derivatives of h. Height (cm) 250 200 150 100 50 t (days) 20 40 60 80 100 FIGURE 18
The growth of a sunflower during the first 100 days after sprouting is modeled well by the logistic curve 21. y = h(t) shown in Figure 18. Estimate the growth rate at the point of inflection and explain its significance. Then make a rough sketch of the first and second derivatives of h. Height (cm) 250 200 150 100 50 t (days) 20 40 60 80 100 FIGURE 18

Algebra & Trigonometry with Analytic Geometry
13th Edition
ISBN:9781133382119
Author:Swokowski
Publisher:Swokowski
Chapter5: Inverse, Exponential, And Logarithmic Functions
Section: Chapter Questions
Problem 9T

Related questions
Question
Transcribed Image Text:The growth of a sunflower during the first 100 days after sprouting is modeled well by the logistic curve
21.
y = h(t) shown in Figure 18. Estimate the growth rate at the point of inflection and explain its significance. Then make
a rough sketch of the first and second derivatives of h.
Height (cm)
250
200
150
100
50
t (days)
20
40
60
80
100
FIGURE 18
Expert Solution
This question has been solved!
Explore an expertly crafted, step-by-step solution for a thorough understanding of key concepts.

This is a popular solution!

Trending now
This is a popular solution!

Step by step
Solved in 2 steps with 2 images

Recommended textbooks for you
Algebra & Trigonometry with Analytic Geometry
Algebra
ISBN:
9781133382119
Author:
Swokowski
Publisher:
Cengage


Linear Algebra: A Modern Introduction
Algebra
ISBN:
9781285463247
Author:
David Poole
Publisher:
Cengage Learning
Algebra & Trigonometry with Analytic Geometry
Algebra
ISBN:
9781133382119
Author:
Swokowski
Publisher:
Cengage
Linear Algebra: A Modern Introduction
Algebra
ISBN:
9781285463247
Author:
David Poole
Publisher:
Cengage Learning