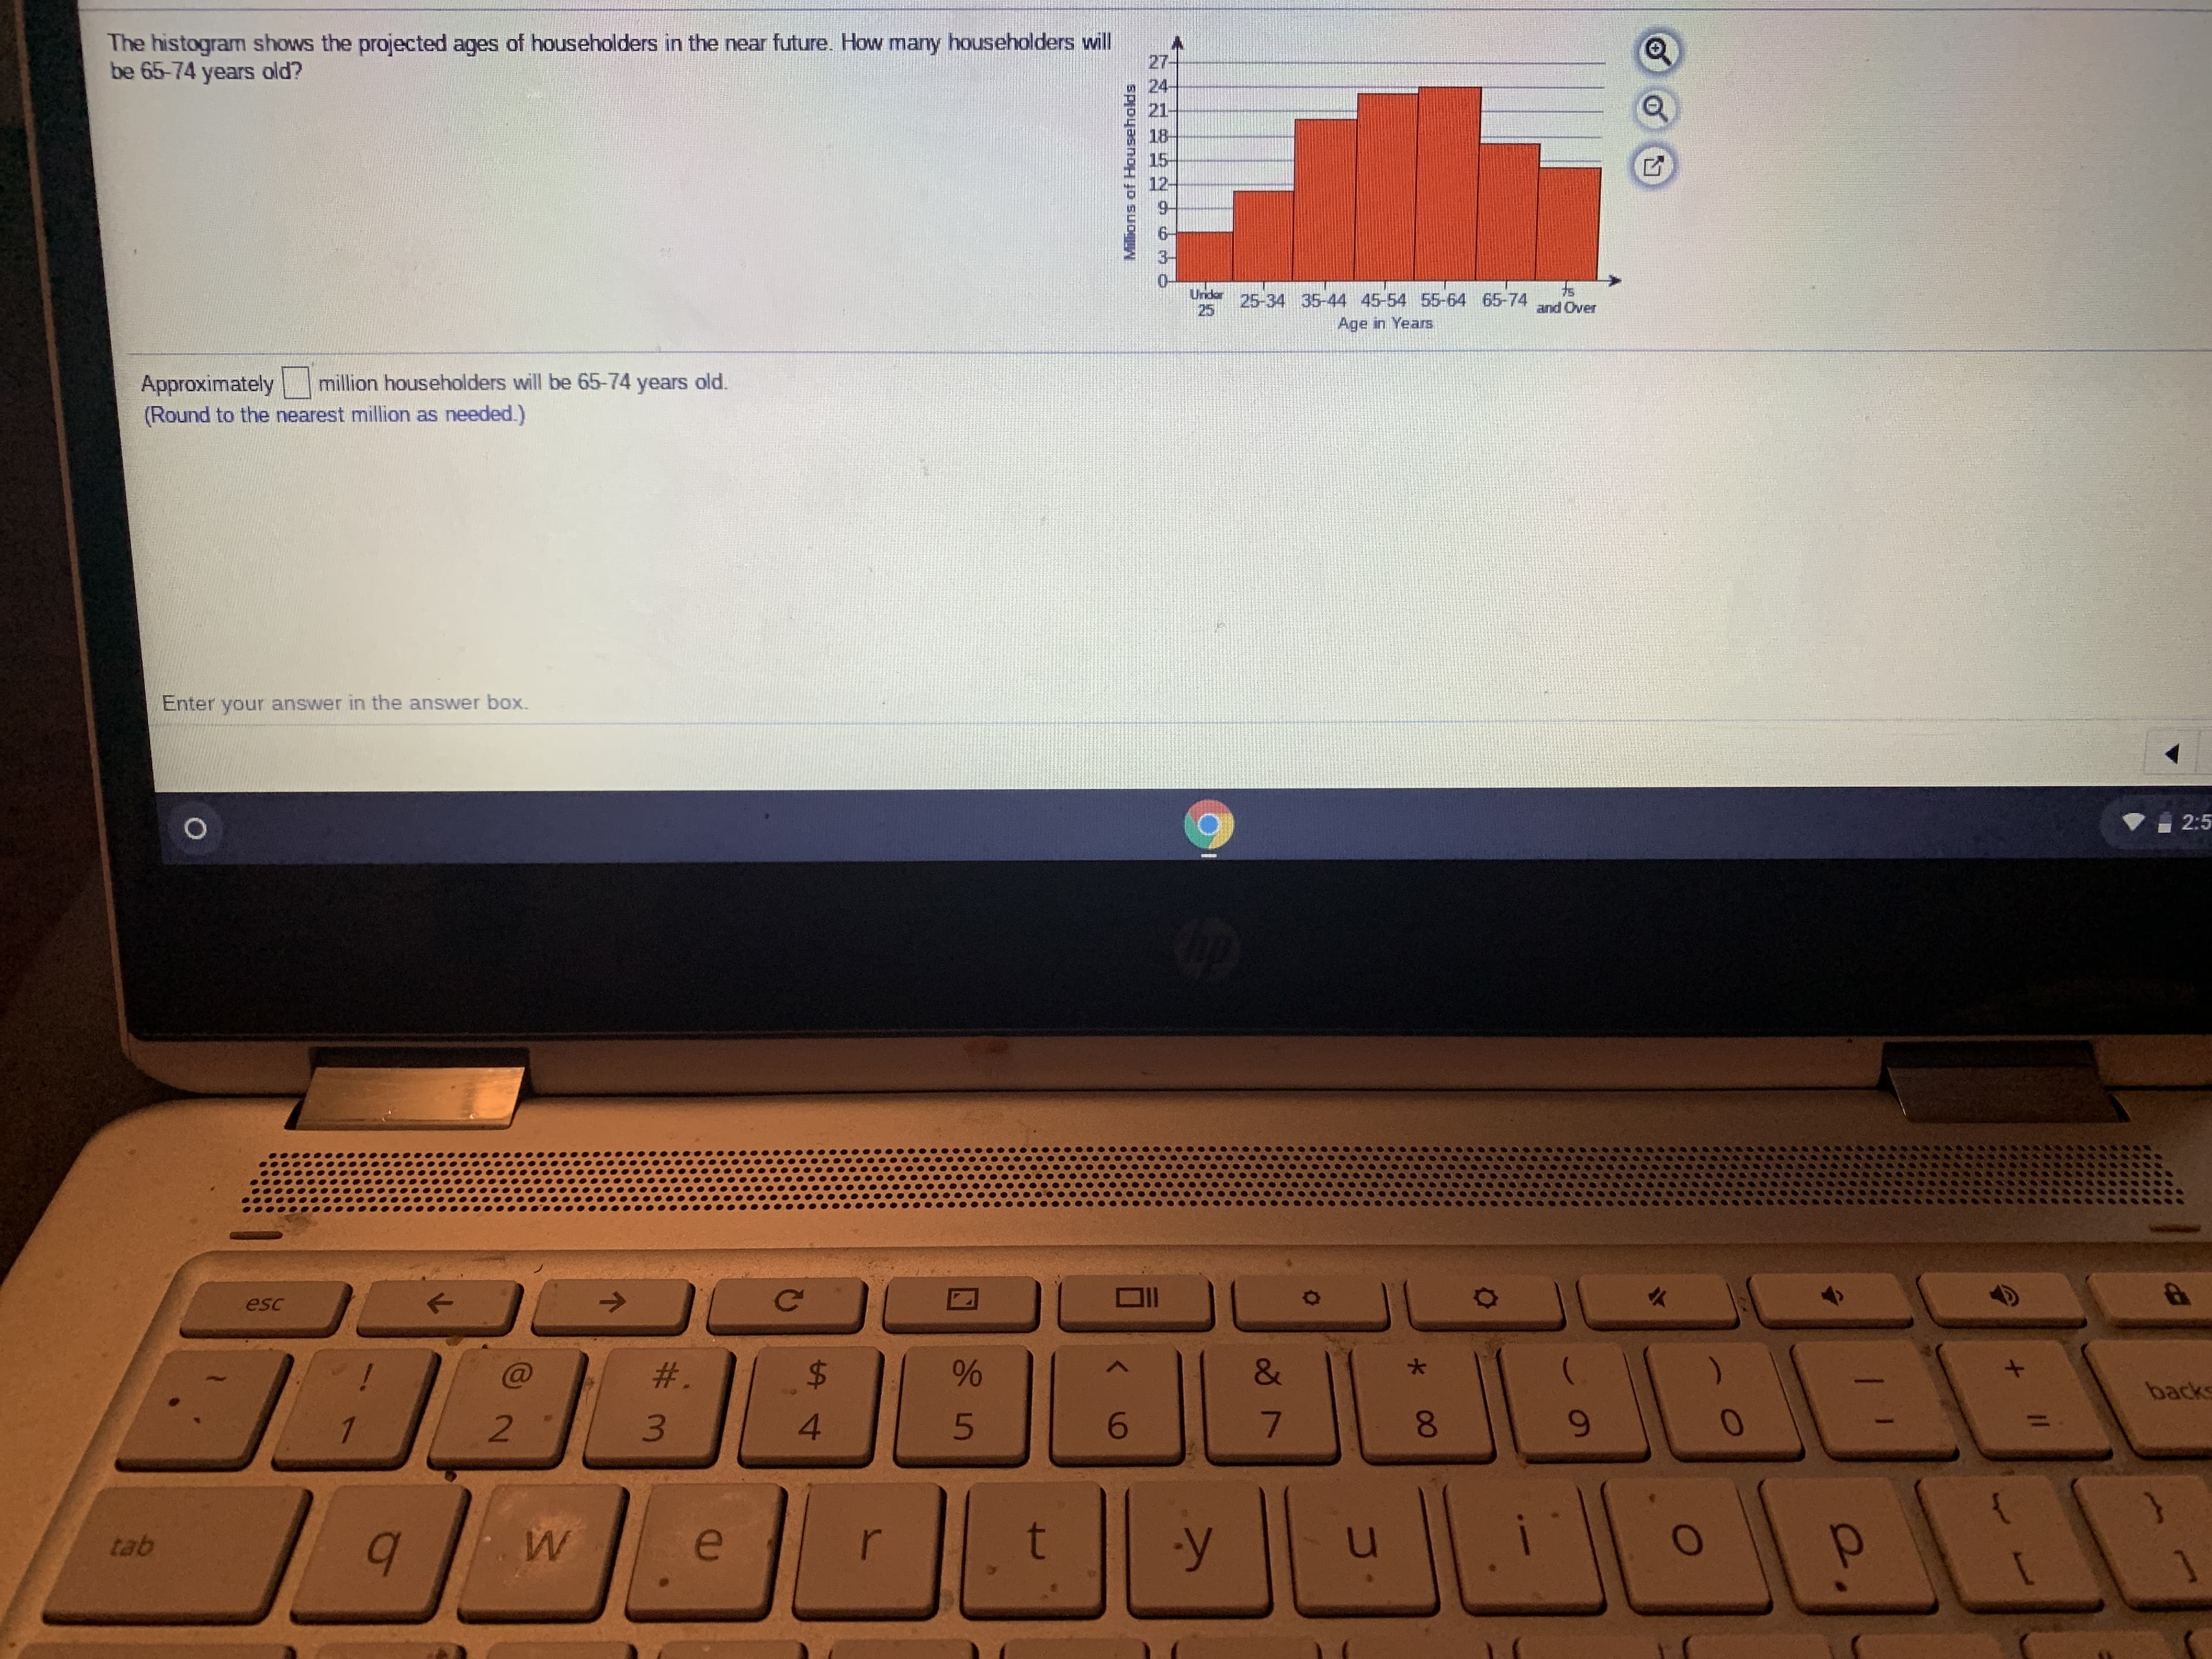
The histogram shows the projected ages of householders in the near future. How many householders will be 65-74 years old? 27- 24 21- 18- 15- 12- Under 25 25-34 35-44 45-54 55-64 65-74 and Over Age in Years Millions of Households
The histogram shows the projected ages of householders in the near future. How many householders will be 65-74 years old? 27- 24 21- 18- 15- 12- Under 25 25-34 35-44 45-54 55-64 65-74 and Over Age in Years Millions of Households

Chapter4: Linear Functions
Section4.3: Fitting Linear Models To Data
Problem 24SE: Table 6 shows the year and the number ofpeople unemployed in a particular city for several years....

Related questions
Topic Video
Question
Transcribed Image Text:The histogram shows the projected ages of householders in the near future. How many householders will
be 65-74 years old?
27-
24
21-
18-
15-
12-
Under
25
25-34 35-44 45-54 55-64 65-74
and Over
Age in Years
Millions of Households
Expert Solution
This question has been solved!
Explore an expertly crafted, step-by-step solution for a thorough understanding of key concepts.

This is a popular solution!

Trending now
This is a popular solution!

Step by step
Solved in 2 steps

Knowledge Booster


Learn more about
Need a deep-dive on the concept behind this application? Look no further. Learn more about this topic, advanced-math and related others by exploring similar questions and additional content below.Recommended textbooks for you

College Algebra (MindTap Course List)
Algebra
ISBN:
9781305652231
Author:
R. David Gustafson, Jeff Hughes
Publisher:
Cengage Learning

Glencoe Algebra 1, Student Edition, 9780079039897…
Algebra
ISBN:
9780079039897
Author:
Carter
Publisher:
McGraw Hill
College Algebra (MindTap Course List)
Algebra
ISBN:
9781305652231
Author:
R. David Gustafson, Jeff Hughes
Publisher:
Cengage Learning
Glencoe Algebra 1, Student Edition, 9780079039897…
Algebra
ISBN:
9780079039897
Author:
Carter
Publisher:
McGraw Hill

Algebra & Trigonometry with Analytic Geometry
Algebra
ISBN:
9781133382119
Author:
Swokowski
Publisher:
Cengage