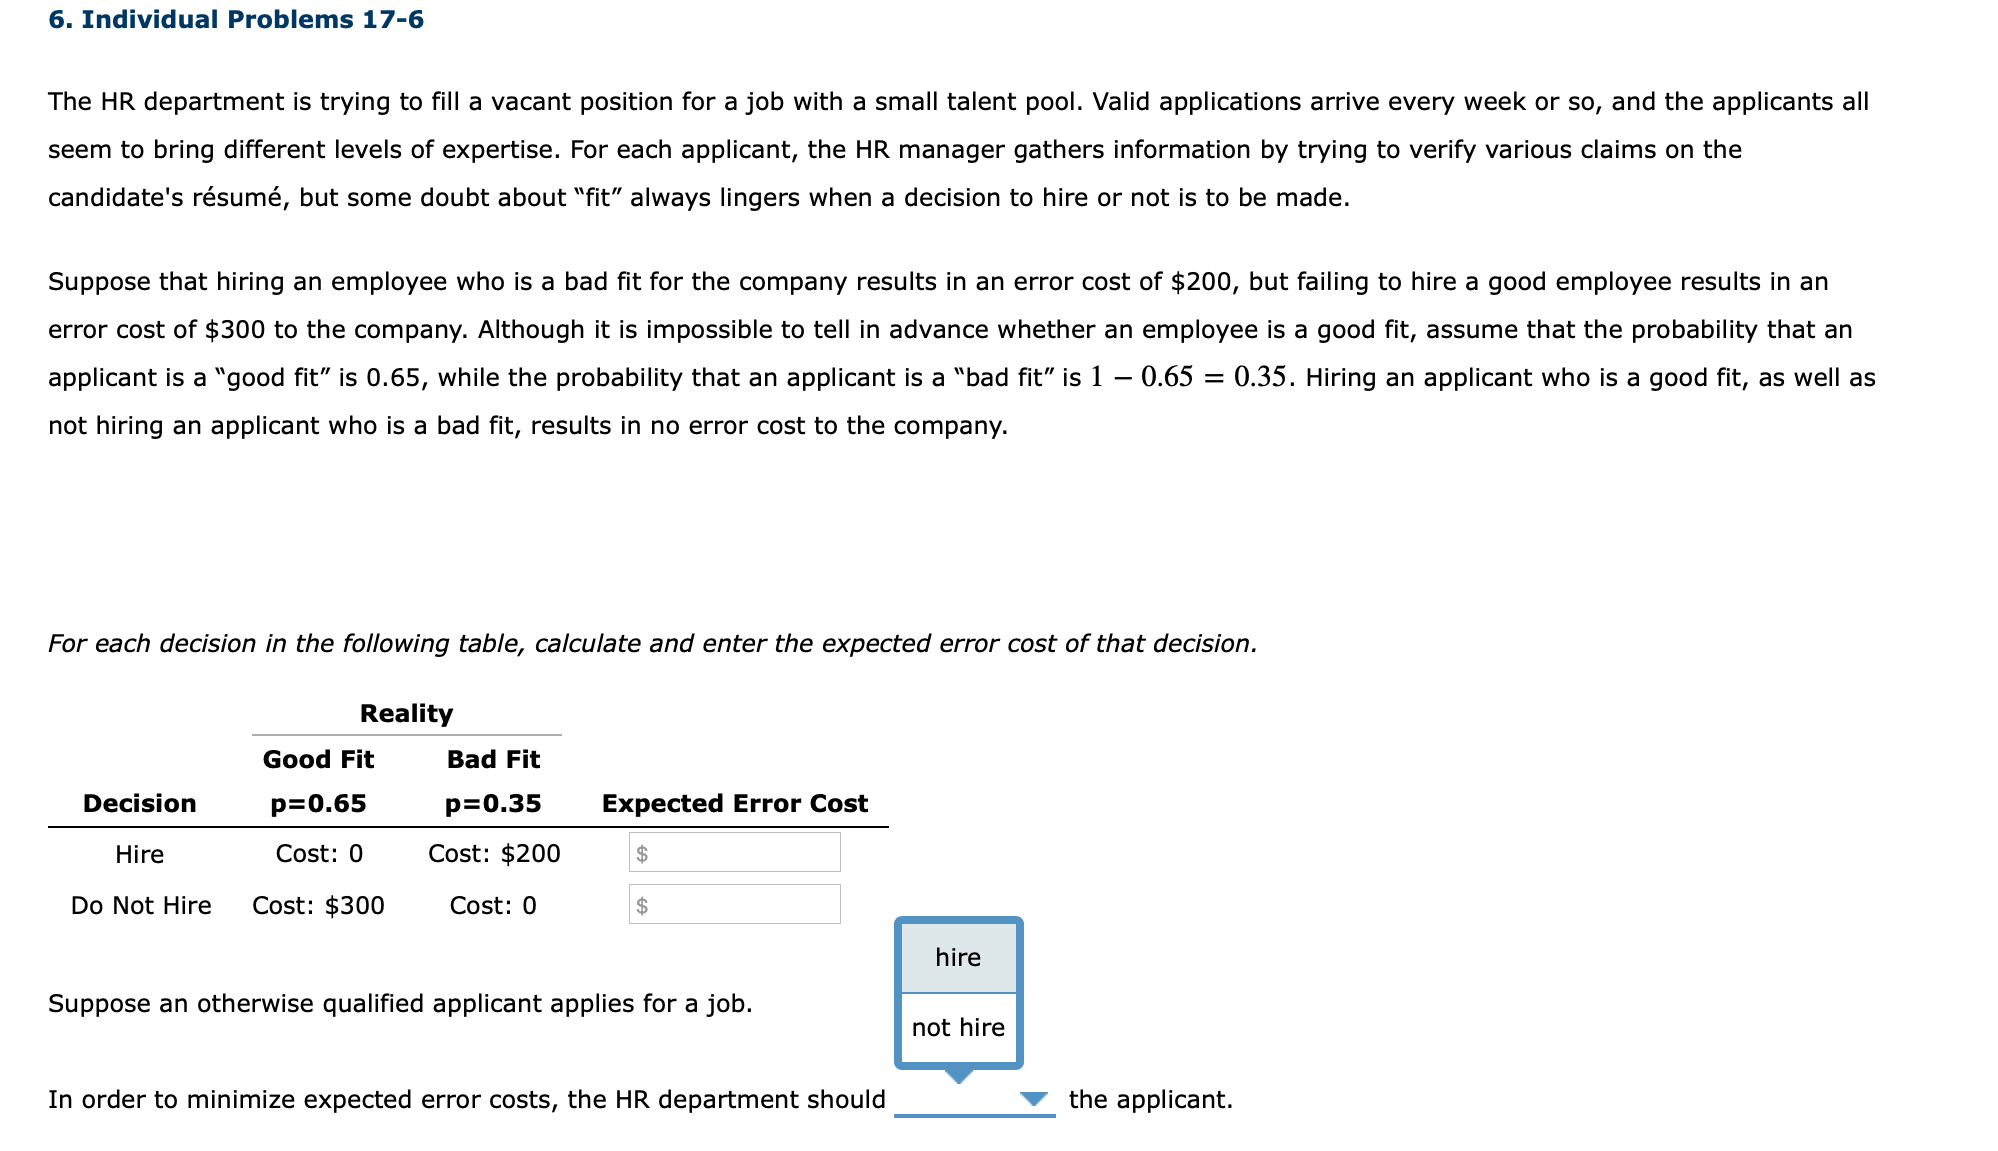
The HR department is trying to fill a vacant position for a job with a small talent pool. Valid applications arrive every week or so, and the applicants all seem to bring different levels of expertise. For each applicant, the HR manager gathers information by trying to verify various claims on the candidate's résumé, but some doubt about "fit" always lingers when a decision to hire or not is to be made. Suppose that hiring an employee who is a bad fit for the company results in an error cost of $200, but failing to hire a good employee results in an error cost of $300 to the company. Although it is impossible to tell in advance whether an employee is a good fit, assume that the probability that an applicant is a "good fit" is 0.65, while the probability that an applicant is a "bad fit" is 1 – 0.65 = 0.35. Hiring an applicant who is a good fit, as well as not hiring an applicant who is a bad fit, results in no error cost to the company. For each decision in the following table, calculate and enter the expected error cost of that decision. Reality Good Fit Bad Fit Decision p=0.65 p=0.35 Expected Error Cost Hire Cost: 0 Cost: $200 2$ Do Not Hire Cost: $300 Cost: 0 2$ hire Suppose an otherwise qualified applicant applies for a job. not hire In order to minimize expected error costs, the HR department should the applicant.
The HR department is trying to fill a vacant position for a job with a small talent pool. Valid applications arrive every week or so, and the applicants all seem to bring different levels of expertise. For each applicant, the HR manager gathers information by trying to verify various claims on the candidate's résumé, but some doubt about "fit" always lingers when a decision to hire or not is to be made. Suppose that hiring an employee who is a bad fit for the company results in an error cost of $200, but failing to hire a good employee results in an error cost of $300 to the company. Although it is impossible to tell in advance whether an employee is a good fit, assume that the probability that an applicant is a "good fit" is 0.65, while the probability that an applicant is a "bad fit" is 1 – 0.65 = 0.35. Hiring an applicant who is a good fit, as well as not hiring an applicant who is a bad fit, results in no error cost to the company. For each decision in the following table, calculate and enter the expected error cost of that decision. Reality Good Fit Bad Fit Decision p=0.65 p=0.35 Expected Error Cost Hire Cost: 0 Cost: $200 2$ Do Not Hire Cost: $300 Cost: 0 2$ hire Suppose an otherwise qualified applicant applies for a job. not hire In order to minimize expected error costs, the HR department should the applicant.

Trigonometry (MindTap Course List)
8th Edition
ISBN:9781305652224
Author:Charles P. McKeague, Mark D. Turner
Publisher:Charles P. McKeague, Mark D. Turner
Chapter8: Complex Numbers And Polarcoordinates
Section: Chapter Questions
Problem 2RP: A Bitter Dispute With the publication of Ars Magna, a dispute intensified between Jerome Cardan and...

Related questions

Concept explainers
Contingency Table
A contingency table can be defined as the visual representation of the relationship between two or more categorical variables that can be evaluated and registered. It is a categorical version of the scatterplot, which is used to investigate the linear relationship between two variables. A contingency table is indeed a type of frequency distribution table that displays two variables at the same time.
Binomial Distribution
Binomial is an algebraic expression of the sum or the difference of two terms. Before knowing about binomial distribution, we must know about the binomial theorem.
Topic Video
Question
Answer all
Transcribed Image Text:The HR department is trying to fill a vacant position for a job with a small talent pool. Valid applications arrive every week or so, and the applicants all
seem to bring different levels of expertise. For each applicant, the HR manager gathers information by trying to verify various claims on the
candidate's résumé, but some doubt about "fit" always lingers when a decision to hire or not is to be made.
Suppose that hiring an employee who is a bad fit for the company results in an error cost of $200, but failing to hire a good employee results in an
error cost of $300 to the company. Although it is impossible to tell in advance whether an employee is a good fit, assume that the probability that an
applicant is a "good fit" is 0.65, while the probability that an applicant is a "bad fit" is 1 – 0.65 = 0.35. Hiring an applicant who is a good fit, as well as
not hiring an applicant who is a bad fit, results in no error cost to the company.
For each decision in the following table, calculate and enter the expected error cost of that decision.
Reality
Good Fit
Bad Fit
Decision
p=0.65
p=0.35
Expected Error Cost
Hire
Cost: 0
Cost: $200
2$
Do Not Hire
Cost: $300
Cost: 0
2$
hire
Suppose an otherwise qualified applicant applies for a job.
not hire
In order to minimize expected error costs, the HR department should
the applicant.
Expert Solution
This question has been solved!
Explore an expertly crafted, step-by-step solution for a thorough understanding of key concepts.

This is a popular solution!

Trending now
This is a popular solution!

Step by step
Solved in 2 steps

Knowledge Booster


Learn more about
Need a deep-dive on the concept behind this application? Look no further. Learn more about this topic, statistics and related others by exploring similar questions and additional content below.Recommended textbooks for you
Trigonometry (MindTap Course List)
Trigonometry
ISBN:
9781305652224
Author:
Charles P. McKeague, Mark D. Turner
Publisher:
Cengage Learning

Algebra & Trigonometry with Analytic Geometry
Algebra
ISBN:
9781133382119
Author:
Swokowski
Publisher:
Cengage

Elementary Geometry For College Students, 7e
Geometry
ISBN:
9781337614085
Author:
Alexander, Daniel C.; Koeberlein, Geralyn M.
Publisher:
Cengage,
Trigonometry (MindTap Course List)
Trigonometry
ISBN:
9781305652224
Author:
Charles P. McKeague, Mark D. Turner
Publisher:
Cengage Learning
Algebra & Trigonometry with Analytic Geometry
Algebra
ISBN:
9781133382119
Author:
Swokowski
Publisher:
Cengage
Elementary Geometry For College Students, 7e
Geometry
ISBN:
9781337614085
Author:
Alexander, Daniel C.; Koeberlein, Geralyn M.
Publisher:
Cengage,

Elementary Geometry for College Students
Geometry
ISBN:
9781285195698
Author:
Daniel C. Alexander, Geralyn M. Koeberlein
Publisher:
Cengage Learning