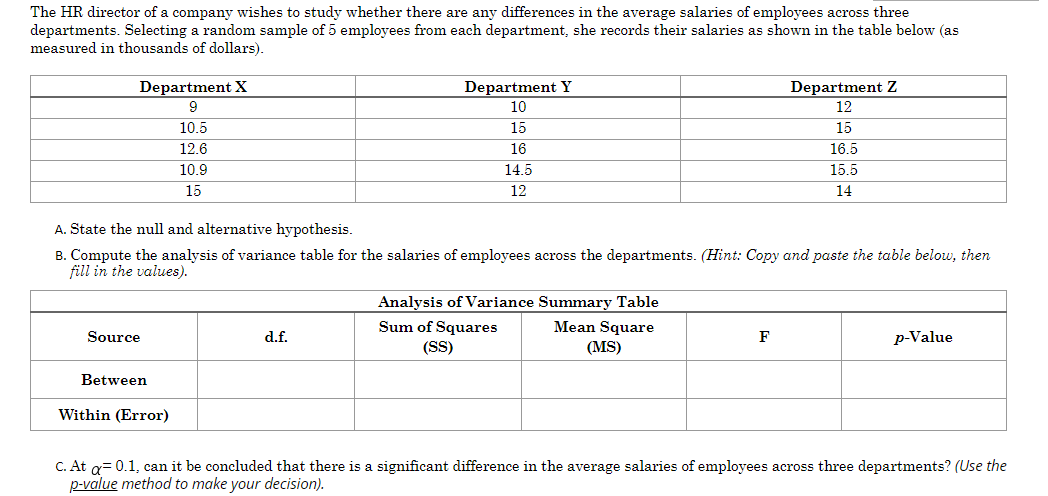
The HR director of a company wishes to study whether there are any differences in the average salaries of employees across three departments. Selecting a random sample of 5 employees from each department, she records their salaries as shown in the table below (as measured in thousands of dollars). Department X Department Y 10 Department Z 9 12 10.5 15 15 12.6 16 16.5 10.9 14.5 15.5 15 12 14 A. State the null and alternative hypothesis. B. Compute the analysis of variance table for the salaries of employees across the departments. (Hint: Copy and paste the table below, then fill in the values). Analysis of Variance Summary Table Sum of Squares (S) Mean Square (MS) Source d.f. F p-Value Between Within (Error) C. At a=0.1, can it be concluded that there is a significant difference in the average salaries of employees across three departments? (Use the n-value method to make vour decision)
The HR director of a company wishes to study whether there are any differences in the average salaries of employees across three departments. Selecting a random sample of 5 employees from each department, she records their salaries as shown in the table below (as measured in thousands of dollars). Department X Department Y 10 Department Z 9 12 10.5 15 15 12.6 16 16.5 10.9 14.5 15.5 15 12 14 A. State the null and alternative hypothesis. B. Compute the analysis of variance table for the salaries of employees across the departments. (Hint: Copy and paste the table below, then fill in the values). Analysis of Variance Summary Table Sum of Squares (S) Mean Square (MS) Source d.f. F p-Value Between Within (Error) C. At a=0.1, can it be concluded that there is a significant difference in the average salaries of employees across three departments? (Use the n-value method to make vour decision)

Holt Mcdougal Larson Pre-algebra: Student Edition 2012
1st Edition
ISBN:9780547587776
Author:HOLT MCDOUGAL
Publisher:HOLT MCDOUGAL
Chapter11: Data Analysis And Probability
Section11.4: Collecting Data
Problem 6E

Related questions

Question
Transcribed Image Text:The HR director of a company wishes to study whether there are any differences in the average salaries of employees across three
departments. Selecting a random sample of 5 employees from each department, she records their salaries as shown in the table below (as
measured in thousands of dollars).
Department X
Department Y
Department Z
10
12
10.5
15
15
12.6
16
16.5
10.9
14.5
15.5
15
12
14
A. State the null and alternative hypothesis.
B. Compute the analysis of variance table for the salaries of employees across the departments. (Hint: Copy and paste the table below, then
fill in the values).
Analysis of Variance Summary Table
Sum of Squares
Mean Square
Source
d.f.
F
p-Value
(S)
(MS)
Between
Within (Error)
C. At a= 0.1, can it be concluded that there is a significant difference in the average salaries of employees across three departments? (Use the
p-value method to make your decision).
Expert Solution
This question has been solved!
Explore an expertly crafted, step-by-step solution for a thorough understanding of key concepts.

Step by step
Solved in 3 steps

Knowledge Booster


Learn more about
Need a deep-dive on the concept behind this application? Look no further. Learn more about this topic, statistics and related others by exploring similar questions and additional content below.Recommended textbooks for you
Holt Mcdougal Larson Pre-algebra: Student Edition…
Algebra
ISBN:
9780547587776
Author:
HOLT MCDOUGAL
Publisher:
HOLT MCDOUGAL

College Algebra (MindTap Course List)
Algebra
ISBN:
9781305652231
Author:
R. David Gustafson, Jeff Hughes
Publisher:
Cengage Learning

Holt Mcdougal Larson Pre-algebra: Student Edition…
Algebra
ISBN:
9780547587776
Author:
HOLT MCDOUGAL
Publisher:
HOLT MCDOUGAL
College Algebra (MindTap Course List)
Algebra
ISBN:
9781305652231
Author:
R. David Gustafson, Jeff Hughes
Publisher:
Cengage Learning