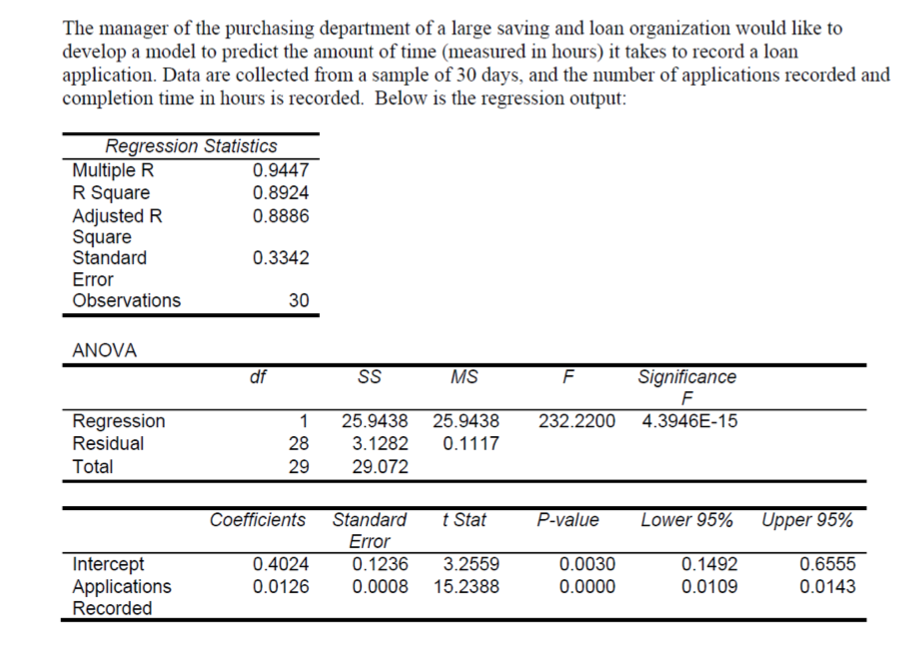
The manager of the purchasing department of a large saving and loan organization would like to develop a model to predict the amount of time (measured in hours) it takes to record a loan application. Data are collected from a sample of 30 days, and the number of applications recorded and completion time in hours is recorded. Below is the regression output: Regression Statistics Multiple R R Square Adjusted R Square Standard 0.9447 0.8924 0.8886 0.3342 Error Observations 30 ANOVA MS Significance df SS 4.3946E-15 Regression 25.9438 25.9438 232.2200 Residual 28 3.1282 0.1117 Total 29 29.072 Coefficients Standard P-value Lower 95% t Stat Upper 95% Error 0.1492 Intercept Applications Recorded 0.4024 0.1236 3.2559 0.0030 0.6555 0.0143 0.0126 0.0008 15.2388 0.0000 0.0109
The manager of the purchasing department of a large saving and loan organization would like to develop a model to predict the amount of time (measured in hours) it takes to record a loan application. Data are collected from a sample of 30 days, and the number of applications recorded and completion time in hours is recorded. Below is the regression output: Regression Statistics Multiple R R Square Adjusted R Square Standard 0.9447 0.8924 0.8886 0.3342 Error Observations 30 ANOVA MS Significance df SS 4.3946E-15 Regression 25.9438 25.9438 232.2200 Residual 28 3.1282 0.1117 Total 29 29.072 Coefficients Standard P-value Lower 95% t Stat Upper 95% Error 0.1492 Intercept Applications Recorded 0.4024 0.1236 3.2559 0.0030 0.6555 0.0143 0.0126 0.0008 15.2388 0.0000 0.0109

Trigonometry (MindTap Course List)
8th Edition
ISBN:9781305652224
Author:Charles P. McKeague, Mark D. Turner
Publisher:Charles P. McKeague, Mark D. Turner
Chapter4: Graphing And Inverse Functions
Section: Chapter Questions
Problem 6GP: If your graphing calculator is capable of computing a least-squares sinusoidal regression model, use...

Related questions

Topic Video
Question
Referring to the above scenario, interpret the coefficient attached to variable applications recorded:
Referring to the above scenario, interpret R Square:
Referring to the above scenario, interpret the F-statistic in the ANOVA analysis:
Referring to above scenario, predict the amount of time it would take on average to process 150 invoices:
Transcribed Image Text:The manager of the purchasing department of a large saving and loan organization would like to
develop a model to predict the amount of time (measured in hours) it takes to record a loan
application. Data are collected from a sample of 30 days, and the number of applications recorded and
completion time in hours is recorded. Below is the regression output:
Regression Statistics
Multiple R
R Square
Adjusted R
Square
Standard
0.9447
0.8924
0.8886
0.3342
Error
Observations
30
ANOVA
MS
Significance
df
SS
4.3946E-15
Regression
25.9438 25.9438
232.2200
Residual
28
3.1282
0.1117
Total
29
29.072
Coefficients
Standard
P-value
Lower 95%
t Stat
Upper 95%
Error
0.1492
Intercept
Applications
Recorded
0.4024
0.1236
3.2559
0.0030
0.6555
0.0143
0.0126
0.0008
15.2388
0.0000
0.0109
Expert Solution
This question has been solved!
Explore an expertly crafted, step-by-step solution for a thorough understanding of key concepts.

This is a popular solution!

Trending now
This is a popular solution!

Step by step
Solved in 4 steps with 1 images

Knowledge Booster


Learn more about
Need a deep-dive on the concept behind this application? Look no further. Learn more about this topic, statistics and related others by exploring similar questions and additional content below.Recommended textbooks for you
Trigonometry (MindTap Course List)
Trigonometry
ISBN:
9781305652224
Author:
Charles P. McKeague, Mark D. Turner
Publisher:
Cengage Learning

College Algebra
Algebra
ISBN:
9781305115545
Author:
James Stewart, Lothar Redlin, Saleem Watson
Publisher:
Cengage Learning

Algebra and Trigonometry (MindTap Course List)
Algebra
ISBN:
9781305071742
Author:
James Stewart, Lothar Redlin, Saleem Watson
Publisher:
Cengage Learning
Trigonometry (MindTap Course List)
Trigonometry
ISBN:
9781305652224
Author:
Charles P. McKeague, Mark D. Turner
Publisher:
Cengage Learning
College Algebra
Algebra
ISBN:
9781305115545
Author:
James Stewart, Lothar Redlin, Saleem Watson
Publisher:
Cengage Learning
Algebra and Trigonometry (MindTap Course List)
Algebra
ISBN:
9781305071742
Author:
James Stewart, Lothar Redlin, Saleem Watson
Publisher:
Cengage Learning

Functions and Change: A Modeling Approach to Coll…
Algebra
ISBN:
9781337111348
Author:
Bruce Crauder, Benny Evans, Alan Noell
Publisher:
Cengage Learning