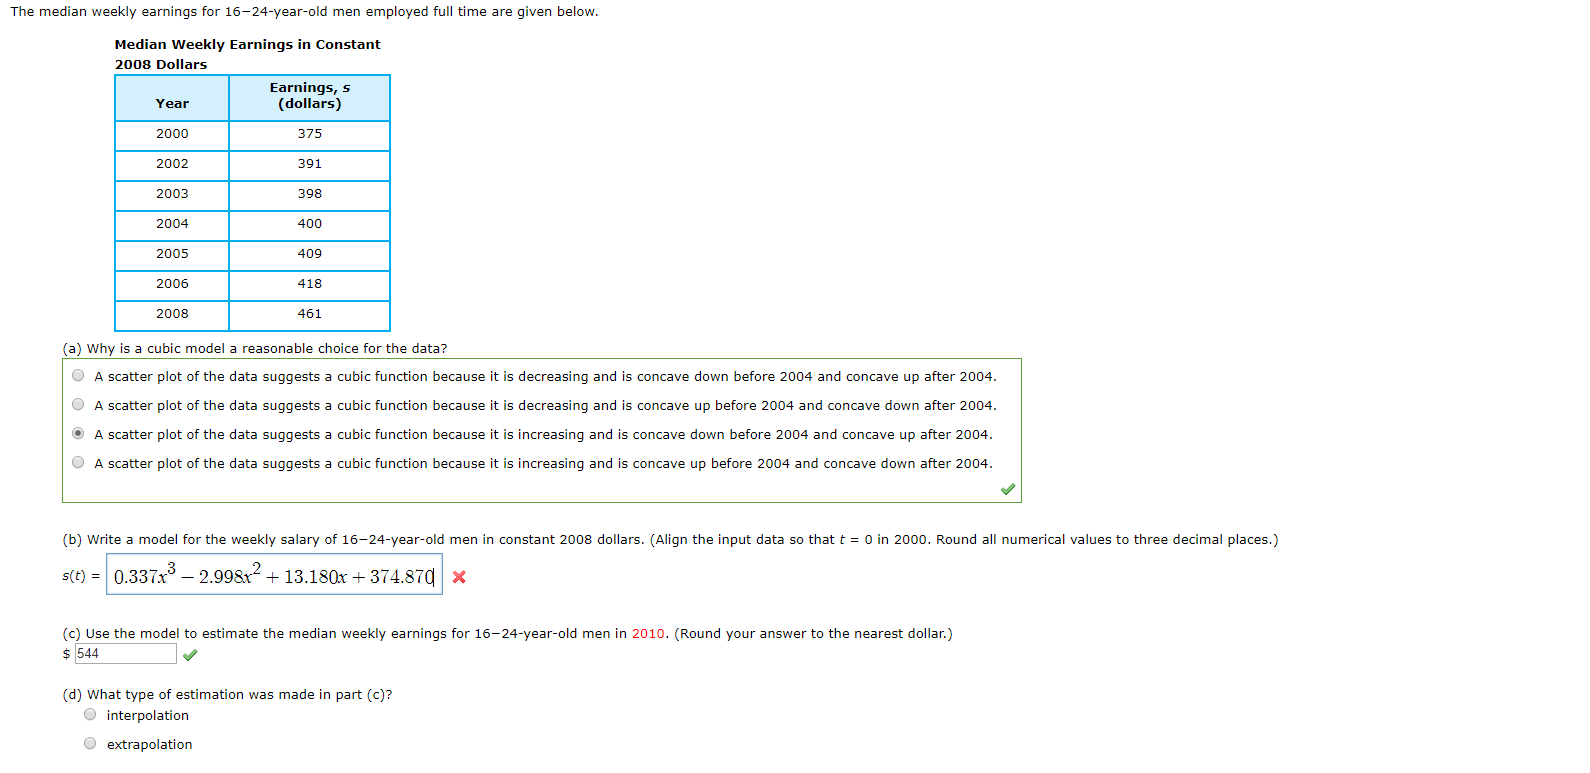
The median weekly earnings for 16-24-year-old men employed full time are given below. Median Weekly Earnings in Constant 2008 Dollars Earnings, s (dollars) Year 2000 375 2002 391 2003 398 2004 400 2005 409 2006 418 2008 461 (a) Why is a cubic model a reasonable choice for the data? OA scatter plot of the data suggests a cubic function because it is decreasing and is concave down before 2004 and concave up after 2004 A scatter plot of the data suggests a cubic function because it is decreasing and is concave up before 2004 and concave down after 2004 O A scatter plot of the data suggests a cubic function because it is increasing and is concave down before 2004 and concave up after 2004. OA scatter plot of the data suggests a cubic function because it is increasing and is concave up before 2004 and concave down after 2004. (b) Write a model for the weekly salary of 16-24-year-old men in constant 2008 dollars. (Align the input data so that t 0 in 2000. Round all numerical values to three decimal places.) s(t) 0.33732.9982 13.180 374.870X (c) Use the model to estimate the median weekly earnings for 16-24-year-old men in 2010. (Round your answer to the nearest dollar.) 544 (d) What type of estimation was made in part (c)? interpolation extrapolation
The median weekly earnings for 16-24-year-old men employed full time are given below. Median Weekly Earnings in Constant 2008 Dollars Earnings, s (dollars) Year 2000 375 2002 391 2003 398 2004 400 2005 409 2006 418 2008 461 (a) Why is a cubic model a reasonable choice for the data? OA scatter plot of the data suggests a cubic function because it is decreasing and is concave down before 2004 and concave up after 2004 A scatter plot of the data suggests a cubic function because it is decreasing and is concave up before 2004 and concave down after 2004 O A scatter plot of the data suggests a cubic function because it is increasing and is concave down before 2004 and concave up after 2004. OA scatter plot of the data suggests a cubic function because it is increasing and is concave up before 2004 and concave down after 2004. (b) Write a model for the weekly salary of 16-24-year-old men in constant 2008 dollars. (Align the input data so that t 0 in 2000. Round all numerical values to three decimal places.) s(t) 0.33732.9982 13.180 374.870X (c) Use the model to estimate the median weekly earnings for 16-24-year-old men in 2010. (Round your answer to the nearest dollar.) 544 (d) What type of estimation was made in part (c)? interpolation extrapolation

Trigonometry (MindTap Course List)
10th Edition
ISBN:9781337278461
Author:Ron Larson
Publisher:Ron Larson
Chapter5: Exponential And Logarithmic Functions
Section5.5: Exponential And Logarithmic Models
Problem 4ECP

Related questions
Topic Video
Question
B) AND D) HARD
Transcribed Image Text:The median weekly earnings for 16-24-year-old men employed full time are given below.
Median Weekly Earnings in Constant
2008 Dollars
Earnings, s
(dollars)
Year
2000
375
2002
391
2003
398
2004
400
2005
409
2006
418
2008
461
(a) Why is a cubic model a reasonable choice for the data?
OA scatter plot of the data suggests a cubic function because it is decreasing and is concave down before 2004 and concave up after 2004
A scatter plot of the data suggests a cubic function because it is decreasing and is concave up before 2004 and concave down after 2004
O A scatter plot of the data suggests a cubic function because it is increasing and is concave down before 2004 and concave up after 2004.
OA scatter plot of the data suggests a cubic function because it is increasing and is concave up before 2004 and concave down after 2004.
(b) Write a model for the weekly salary of 16-24-year-old men in constant 2008 dollars. (Align the input data so that t
0 in 2000. Round all numerical values to three decimal places.)
s(t) 0.33732.9982
13.180 374.870X
(c) Use the model to estimate the median weekly earnings for 16-24-year-old men in 2010. (Round your answer to the nearest dollar.)
544
(d) What type of estimation was made in part (c)?
interpolation
extrapolation
Expert Solution
This question has been solved!
Explore an expertly crafted, step-by-step solution for a thorough understanding of key concepts.

This is a popular solution!

Trending now
This is a popular solution!

Step by step
Solved in 3 steps with 2 images

Knowledge Booster


Learn more about
Need a deep-dive on the concept behind this application? Look no further. Learn more about this topic, calculus and related others by exploring similar questions and additional content below.Recommended textbooks for you
Trigonometry (MindTap Course List)
Trigonometry
ISBN:
9781337278461
Author:
Ron Larson
Publisher:
Cengage Learning


Algebra & Trigonometry with Analytic Geometry
Algebra
ISBN:
9781133382119
Author:
Swokowski
Publisher:
Cengage
Trigonometry (MindTap Course List)
Trigonometry
ISBN:
9781337278461
Author:
Ron Larson
Publisher:
Cengage Learning
Algebra & Trigonometry with Analytic Geometry
Algebra
ISBN:
9781133382119
Author:
Swokowski
Publisher:
Cengage

Functions and Change: A Modeling Approach to Coll…
Algebra
ISBN:
9781337111348
Author:
Bruce Crauder, Benny Evans, Alan Noell
Publisher:
Cengage Learning

College Algebra
Algebra
ISBN:
9781305115545
Author:
James Stewart, Lothar Redlin, Saleem Watson
Publisher:
Cengage Learning

Algebra and Trigonometry (MindTap Course List)
Algebra
ISBN:
9781305071742
Author:
James Stewart, Lothar Redlin, Saleem Watson
Publisher:
Cengage Learning