The National Weather Service says that the mean daily high temperature for October in a large mid-western city is 56°F. A local weather service suspects that this value is not accurate and wants to perform a hypothesis test to determine whether the mean is actually lower than 56°F. A sample of mean daily high temperatures for October over the past 37 years yields a sample mean of 54° F. Assume that the population standard deviation is 5.6° F. Perform the hypothesis test at the 1% significance level. STEP 1. Ho: H O H1:H NOTE: For enter/= STEP 2. This test is (e) left-tailed, (f) two-tailed or (g) right-tailed test. This test is (enter e, f or g) STEP 3. The critical value (s) is Use the following chart to identify the critical value (s) Left-tailed Two-tailed Right tailed a =10% z = -1.28 (A) z = 71.65 (B) z =1.28 (C) a =5% z = -1.65 (D) z = 71.96 (E) z = -1.65 (F) a =1% z = -2.33 (G) z = 72.58 (H) z = -2.33 (1) The critical value (s) is/are (Enter a letter A through I)
The National Weather Service says that the mean daily high temperature for October in a large mid-western city is 56°F. A local weather service suspects that this value is not accurate and wants to perform a hypothesis test to determine whether the mean is actually lower than 56°F. A sample of mean daily high temperatures for October over the past 37 years yields a sample mean of 54° F. Assume that the population standard deviation is 5.6° F. Perform the hypothesis test at the 1% significance level. STEP 1. Ho: H O H1:H NOTE: For enter/= STEP 2. This test is (e) left-tailed, (f) two-tailed or (g) right-tailed test. This test is (enter e, f or g) STEP 3. The critical value (s) is Use the following chart to identify the critical value (s) Left-tailed Two-tailed Right tailed a =10% z = -1.28 (A) z = 71.65 (B) z =1.28 (C) a =5% z = -1.65 (D) z = 71.96 (E) z = -1.65 (F) a =1% z = -2.33 (G) z = 72.58 (H) z = -2.33 (1) The critical value (s) is/are (Enter a letter A through I)

MATLAB: An Introduction with Applications
6th Edition
ISBN:9781119256830
Author:Amos Gilat
Publisher:Amos Gilat
Chapter1: Starting With Matlab
Section: Chapter Questions
Problem 1P

Related questions
Topic Video
Question
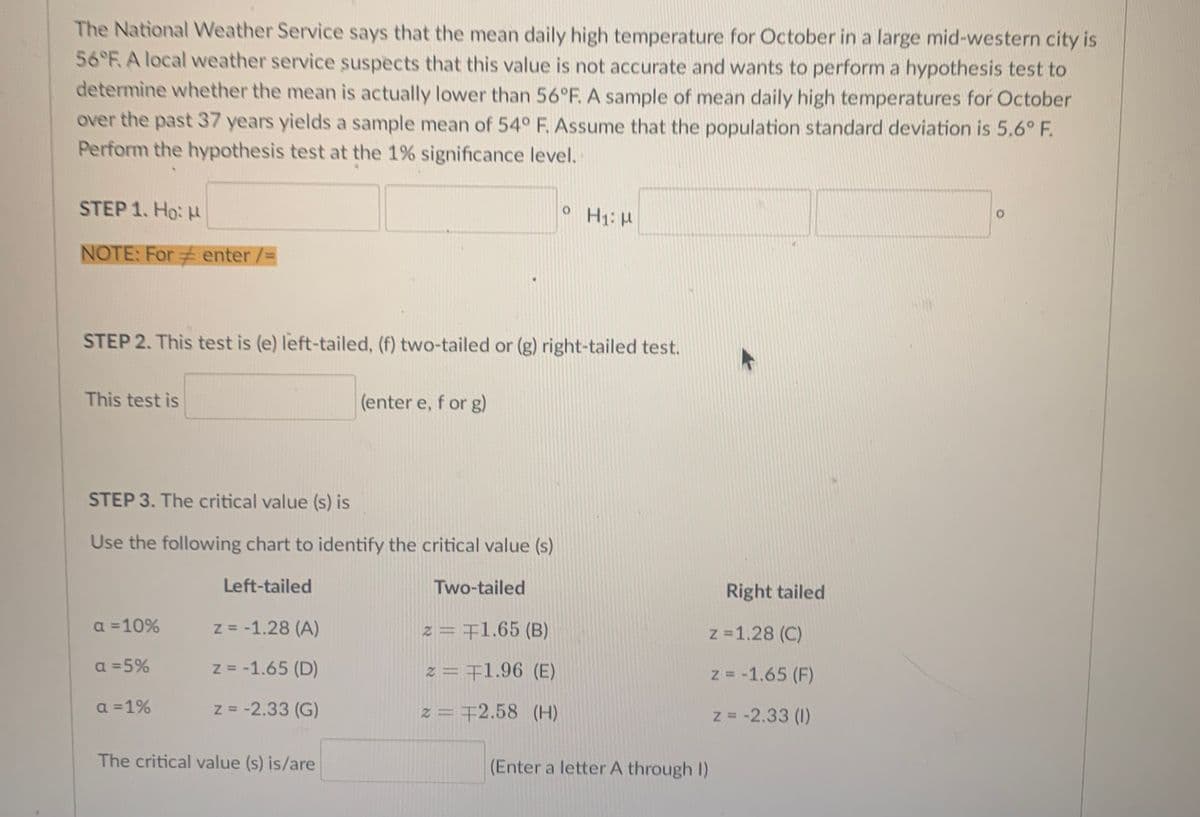
Transcribed Image Text:The National Weather Service says that the mean daily high temperature for October in a large mid-western city is
56°F. A local weather service suspects that this value is not accurate and wants to perform a hypothesis test to
determine whether the mean is actually lower than 56°F. A sample of mean daily high temperatures for October
over the past 37 years yields a sample mean of 54° F. Assume that the population standard deviation is 5.6° F.
Perform the hypothesis test at the 1% significance level.
STEP 1. Ho: H
O H:H
NOTE: For enter/=
STEP 2. This test is (e) left-tailed, (f) two-tailed or (g) right-tailed test.
This test is
(enter e, f or g)
STEP 3. The critical value (s) is
Use the following chart to identify the critical value (s)
Left-tailed
Two-tailed
Right tailed
a =10%
z = -1.28 (A)
z = 71.65 (B)
z =1.28 (C)
a =5%
z = -1.65 (D)
2=王1.96 (E)
z = -1.65 (F)
a =1%
z = -2.33 (G)
z=千2.58 (H)
z = -2.33 (1)
The critical value (s) is/are
(Enter a letter A through I)
![STEP 3. The critical value (s) is
Use the following chart to identify the critical value (s)
Left-tailed
Two-tailed
Right tailed
a =10%
z = -1.28 (A)
z = 71.65 (B)
z =1.28 (C)
α-5%
z = -1.65 (D)
z = 71.96 (E)
Z = -1.65 (F)
a =1%
Z = -2.33 (G)
z = 72.58 (H)
z = -2.33 (1)
The critical value (s) is/are
(Entér a letter A through I)
STEP 4. The test statistics is
(Enter a z-score rounded to two decimal places)
The test statistics is z = [g]
STEP 5. Make the decision.
A: Reject the null hypothesis
B: Do not reject the null hypothesis.
The decision is
(Enter A or B)](/v2/_next/image?url=https%3A%2F%2Fcontent.bartleby.com%2Fqna-images%2Fquestion%2Ffa1d78d6-5dd0-4011-adb8-88f449be56e0%2F656c608d-7169-4082-bd00-dc75da729feb%2Fk4m5jxr_processed.jpeg&w=3840&q=75)
Transcribed Image Text:STEP 3. The critical value (s) is
Use the following chart to identify the critical value (s)
Left-tailed
Two-tailed
Right tailed
a =10%
z = -1.28 (A)
z = 71.65 (B)
z =1.28 (C)
α-5%
z = -1.65 (D)
z = 71.96 (E)
Z = -1.65 (F)
a =1%
Z = -2.33 (G)
z = 72.58 (H)
z = -2.33 (1)
The critical value (s) is/are
(Entér a letter A through I)
STEP 4. The test statistics is
(Enter a z-score rounded to two decimal places)
The test statistics is z = [g]
STEP 5. Make the decision.
A: Reject the null hypothesis
B: Do not reject the null hypothesis.
The decision is
(Enter A or B)
Expert Solution
This question has been solved!
Explore an expertly crafted, step-by-step solution for a thorough understanding of key concepts.

This is a popular solution!

Trending now
This is a popular solution!

Step by step
Solved in 5 steps with 5 images

Knowledge Booster


Learn more about
Need a deep-dive on the concept behind this application? Look no further. Learn more about this topic, statistics and related others by exploring similar questions and additional content below.Recommended textbooks for you
MATLAB: An Introduction with Applications
Statistics
ISBN:
9781119256830
Author:
Amos Gilat
Publisher:
John Wiley & Sons Inc

Probability and Statistics for Engineering and th…
Statistics
ISBN:
9781305251809
Author:
Jay L. Devore
Publisher:
Cengage Learning

Statistics for The Behavioral Sciences (MindTap C…
Statistics
ISBN:
9781305504912
Author:
Frederick J Gravetter, Larry B. Wallnau
Publisher:
Cengage Learning
MATLAB: An Introduction with Applications
Statistics
ISBN:
9781119256830
Author:
Amos Gilat
Publisher:
John Wiley & Sons Inc
Probability and Statistics for Engineering and th…
Statistics
ISBN:
9781305251809
Author:
Jay L. Devore
Publisher:
Cengage Learning
Statistics for The Behavioral Sciences (MindTap C…
Statistics
ISBN:
9781305504912
Author:
Frederick J Gravetter, Larry B. Wallnau
Publisher:
Cengage Learning

Elementary Statistics: Picturing the World (7th E…
Statistics
ISBN:
9780134683416
Author:
Ron Larson, Betsy Farber
Publisher:
PEARSON

The Basic Practice of Statistics
Statistics
ISBN:
9781319042578
Author:
David S. Moore, William I. Notz, Michael A. Fligner
Publisher:
W. H. Freeman

Introduction to the Practice of Statistics
Statistics
ISBN:
9781319013387
Author:
David S. Moore, George P. McCabe, Bruce A. Craig
Publisher:
W. H. Freeman