the Paiute Indian Reservation in Nevada. The lake is famous for cutthroat trout. Suppose a friend tells you that the average length of trout caught in Pyramid Lake is ? = 19 inches. However, a survey reported that of a random sample of 51 fish caught, the mean length was x = 18.6 inches, with estimated standard deviation s = 2.9 inches.


Inverse Normal Distribution
The method used for finding the corresponding z-critical value in a normal distribution using the known probability is said to be an inverse normal distribution. The inverse normal distribution is a continuous probability distribution with a family of two parameters.
Mean, Median, Mode
It is a descriptive summary of a data set. It can be defined by using some of the measures. The central tendencies do not provide information regarding individual data from the dataset. However, they give a summary of the data set. The central tendency or measure of central tendency is a central or typical value for a probability distribution.
Z-Scores
A z-score is a unit of measurement used in statistics to describe the position of a raw score in terms of its distance from the mean, measured with reference to standard deviation from the mean. Z-scores are useful in statistics because they allow comparison between two scores that belong to different normal distributions.
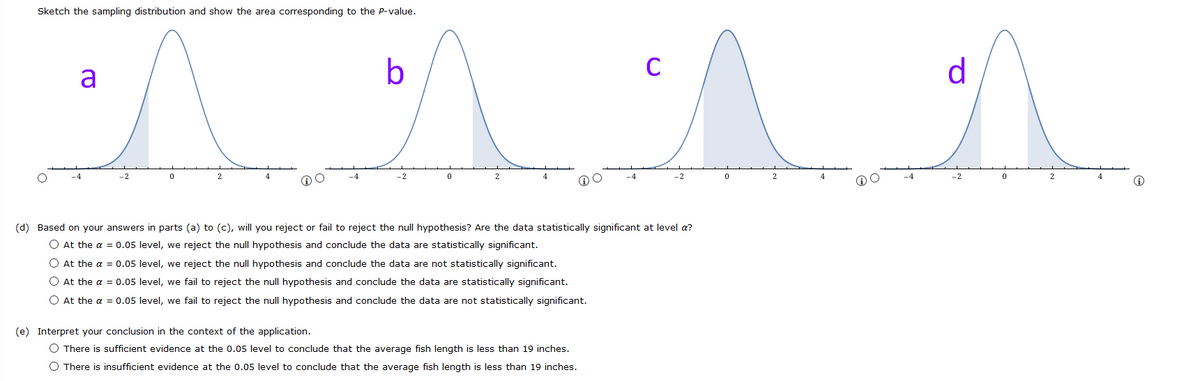
![Pyramid Lake is on the Paiute Indian Reservation in Nevada. The lake is famous for cutthroat trout. Suppose a friend tells you that the average length of trout caught in Pyramid Lake is u = 19 inches. However, a survey reported that of a random sample of 51 fish
caught, the mean length was x = 18.6 inches, with estimated standard deviation s = 2.9 inches. Do these data indicate that the average length of a trout caught in Pyramid Lake is less than u = 19 inches? Use a = 0.05.
(a) What is the level of significance?
State the null and alternate hypotheses.
Ο Hρ: μ- 19 in; H: μ > 19 in
O Ho: H > 19 in; H,: µ = 19 in
Ο Hg: μ = 19 in; H1: μ+ 19 in
Ο Hρ: μ= 19 in; H]: μ< 19 in
Ο Hρ: μ< 19 in; H1: μ = 19 in
(b) What sampling distribution will you use? Explain the rationale for your choice of sampling distribution.
O The Student's t, since the sample size is large and o is unknown.
O The standard normal, since the sample size is large and o is unknown.
O The standard normal, since the sample size is large and o is known.
O The Student's t, since the sample size is large and o is known.
What is the value of the sample test statistic? (Round your answer to three decimal places.)
(c) Estimate the P-value.
O p-value > 0.010
O 0.0010 < P-value < 0.010
O 0.250 < P-value < 0.0010
O 0.125 < P-value < 0.250
O P-value < 0.125](/v2/_next/image?url=https%3A%2F%2Fcontent.bartleby.com%2Fqna-images%2Fquestion%2F22c349f2-c3a1-48c2-b96f-29386a66e13c%2F91624d27-5c0c-4a9a-bd60-35424224eb2c%2Fcqhwfo9_processed.png&w=3840&q=75)

Step by step
Solved in 3 steps with 7 images


