The paper "Study on the Life Distribution of Microdrills" (J. of Engr. Manufacture, 2002: 301–305) reported the following observations, listed in increasing order, on drill lifetime (number of holes that a drill machines before it breaks) when holes were drilled in a certain brass alloy 11 14 20 31 36 39 44 47 50 59 61 65 67 68 71 74 76 78 79 81 84 85 89 91 93 96 99 101 104 105 105 112 118 123 136 139 141 148 158 161 168 184 206 248 263 289 322 388 513 i. Construct the frequency table using the following classes: 0-50, 51-100, etc. What is the range of the data? In a tabular Form, calculate the ii. iii. a. Class Mark. b. Relative Frequency c. Cumulative Frequency d. Relative Cumulative Frequency 23
The paper "Study on the Life Distribution of Microdrills" (J. of Engr. Manufacture, 2002: 301–305) reported the following observations, listed in increasing order, on drill lifetime (number of holes that a drill machines before it breaks) when holes were drilled in a certain brass alloy 11 14 20 31 36 39 44 47 50 59 61 65 67 68 71 74 76 78 79 81 84 85 89 91 93 96 99 101 104 105 105 112 118 123 136 139 141 148 158 161 168 184 206 248 263 289 322 388 513 i. Construct the frequency table using the following classes: 0-50, 51-100, etc. What is the range of the data? In a tabular Form, calculate the ii. iii. a. Class Mark. b. Relative Frequency c. Cumulative Frequency d. Relative Cumulative Frequency 23

A First Course in Probability (10th Edition)
10th Edition
ISBN:9780134753119
Author:Sheldon Ross
Publisher:Sheldon Ross
Chapter1: Combinatorial Analysis
Section: Chapter Questions
Problem 1.1P: a. How many different 7-place license plates are possible if the first 2 places are for letters and...

Related questions
Topic Video
Question
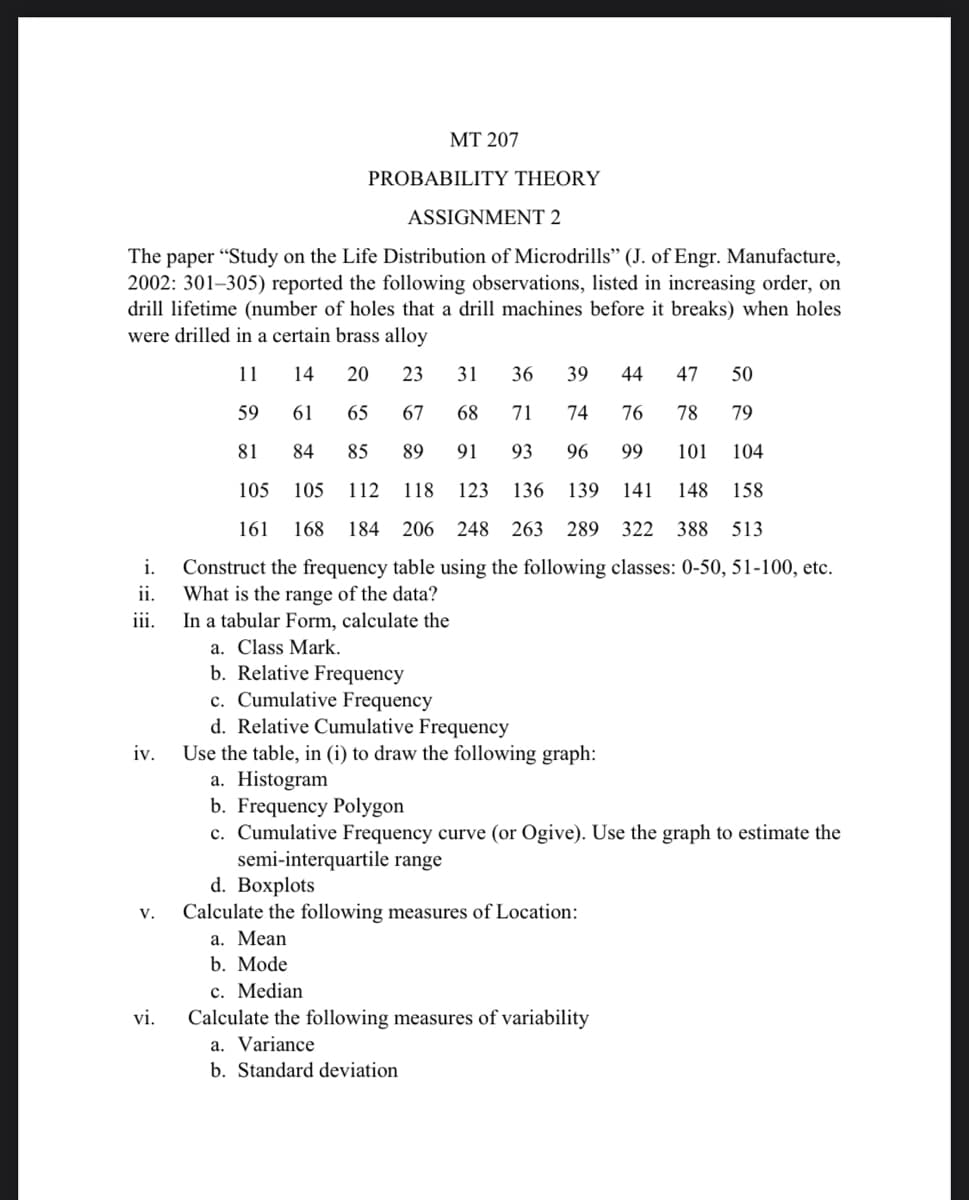
Transcribed Image Text:МТ 207
PROBABILITY THEORY
ASSIGNMENT 2
The paper "Study on the Life Distribution of Microdrills" (J. of Engr. Manufacture,
2002: 301–305) reported the following observations, listed in increasing order, on
drill lifetime (number of holes that a drill machines before it breaks) when holes
were drilled in a certain brass alloy
11
14
20
23
31
36
39
44
47
50
59
61
65
67
68
71
74
76
78
79
81
84
85
89
91
93
96
99
101
104
105
105
112
118
123
136
139
141
148 158
161
168
184
206 248
263 289 322 388 513
i.
Construct the frequency table using the following classes: 0-50, 51-100, etc.
What is the range of the data?
In a tabular Form, calculate the
ii.
ii.
a. Class Mark.
b. Relative Frequency
c. Cumulative Frequency
d. Relative Cumulative Frequency
Use the table, in (i) to draw the following graph:
a. Histogram
b. Frequency Polygon
c. Cumulative Frequency curve (or Ogive). Use the graph to estimate the
semi-interquartile range
d. Bоxplots
iv.
V.
Calculate the following measures of Location:
а. Мean
b. Mode
c. Median
Calculate the following measures of variability
vi.
a. Variance
b. Standard deviation
Expert Solution
This question has been solved!
Explore an expertly crafted, step-by-step solution for a thorough understanding of key concepts.

This is a popular solution!

Trending now
This is a popular solution!

Step by step
Solved in 3 steps

Knowledge Booster


Learn more about
Need a deep-dive on the concept behind this application? Look no further. Learn more about this topic, probability and related others by exploring similar questions and additional content below.Recommended textbooks for you
A First Course in Probability (10th Edition)
Probability
ISBN:
9780134753119
Author:
Sheldon Ross
Publisher:
PEARSON

A First Course in Probability (10th Edition)
Probability
ISBN:
9780134753119
Author:
Sheldon Ross
Publisher:
PEARSON