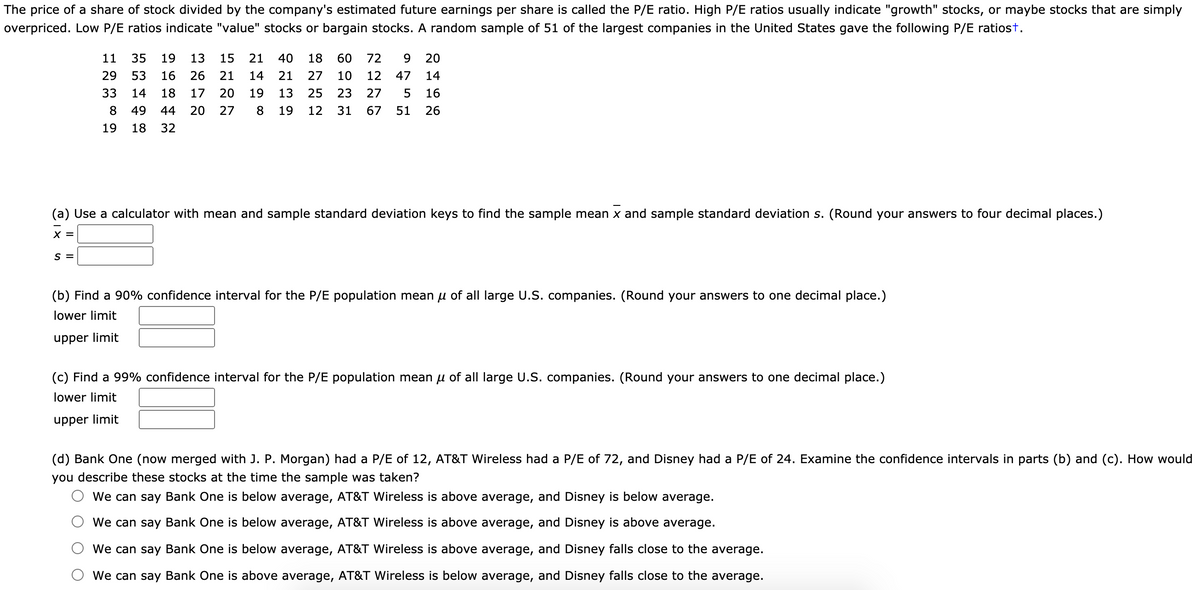
The price of a share of stock divided by the company's estimated future earnings per share is called the P/E ratio. High P/E ratios usually indicate "growth" stocks, or maybe stocks that are simply overpriced. Low P/E ratios indicate "value" stocks or bargain stocks. A random sample of 51 of the largest companies in the United States gave the following P/E ratiost. 11 35 19 13 15 21 40 18 60 72 9 20 29 53 16 26 21 14 21 27 10 12 47 14 33 14 18 17 20 19 13 25 23 27 5 16 8 49 44 20 27 8 19 12 31 67 51 26 19 18 32 (a) Use a calculator with mean and sample standard deviation keys to find the sample mean x and sample standard deviation s. (Round your answers to four decimal places.) X = S = (b) Find a 90% confidence interval for the P/E population mean u of all large U.S. companies. (Round your answers to one decimal place.) lower limit upper limit (c) Find a 99% confidence interval for the P/E population mean u of all large U.S. companies. (Round your answers to one decimal place.) lower limit upper limit


Inverse Normal Distribution
The method used for finding the corresponding z-critical value in a normal distribution using the known probability is said to be an inverse normal distribution. The inverse normal distribution is a continuous probability distribution with a family of two parameters.
Mean, Median, Mode
It is a descriptive summary of a data set. It can be defined by using some of the measures. The central tendencies do not provide information regarding individual data from the dataset. However, they give a summary of the data set. The central tendency or measure of central tendency is a central or typical value for a probability distribution.
Z-Scores
A z-score is a unit of measurement used in statistics to describe the position of a raw score in terms of its distance from the mean, measured with reference to standard deviation from the mean. Z-scores are useful in statistics because they allow comparison between two scores that belong to different normal distributions.


Trending now
This is a popular solution!

Step by step
Solved in 2 steps with 1 images


