The price of a share of stock divided by the company's estimated future earnings per share is called the P/E ratio. High P/E ratios usually indicate "growth" stocks, or maybe stocks tha are simply overpriced. Low P/E ratios indicate "value" stocks or bargain stocks. A random sample of 51 of the largest companies in the United States gave the following P/E ratiost. 11 35 19 13 15 21 40 18 60 72 20 29 53 16 26 21 14 21 27 10 12 47 14 33 14 18 17 20 19 13 25 23 27 16 49 44 20 27 19 12 31 67 51 26 19 18 32 (a) Use a calculator with mean and sample standard deviation keys to find the sample mean x and sample standard deviation s. (Round your answers to one decimal place.) 25.17 S= 15.472 (b) Find a 90% confidence interval for the P/E population mean u of all large U.S. companies. (Round your answers to one decimal place.) lower limit upper limit
The price of a share of stock divided by the company's estimated future earnings per share is called the P/E ratio. High P/E ratios usually indicate "growth" stocks, or maybe stocks tha are simply overpriced. Low P/E ratios indicate "value" stocks or bargain stocks. A random sample of 51 of the largest companies in the United States gave the following P/E ratiost. 11 35 19 13 15 21 40 18 60 72 20 29 53 16 26 21 14 21 27 10 12 47 14 33 14 18 17 20 19 13 25 23 27 16 49 44 20 27 19 12 31 67 51 26 19 18 32 (a) Use a calculator with mean and sample standard deviation keys to find the sample mean x and sample standard deviation s. (Round your answers to one decimal place.) 25.17 S= 15.472 (b) Find a 90% confidence interval for the P/E population mean u of all large U.S. companies. (Round your answers to one decimal place.) lower limit upper limit

Functions and Change: A Modeling Approach to College Algebra (MindTap Course List)
6th Edition
ISBN:9781337111348
Author:Bruce Crauder, Benny Evans, Alan Noell
Publisher:Bruce Crauder, Benny Evans, Alan Noell
Chapter5: A Survey Of Other Common Functions
Section5.3: Modeling Data With Power Functions
Problem 6E: Urban Travel Times Population of cities and driving times are related, as shown in the accompanying...

Related questions
Topic Video
Question
How do you find a confidence interval of a population mean? I have included the questions.
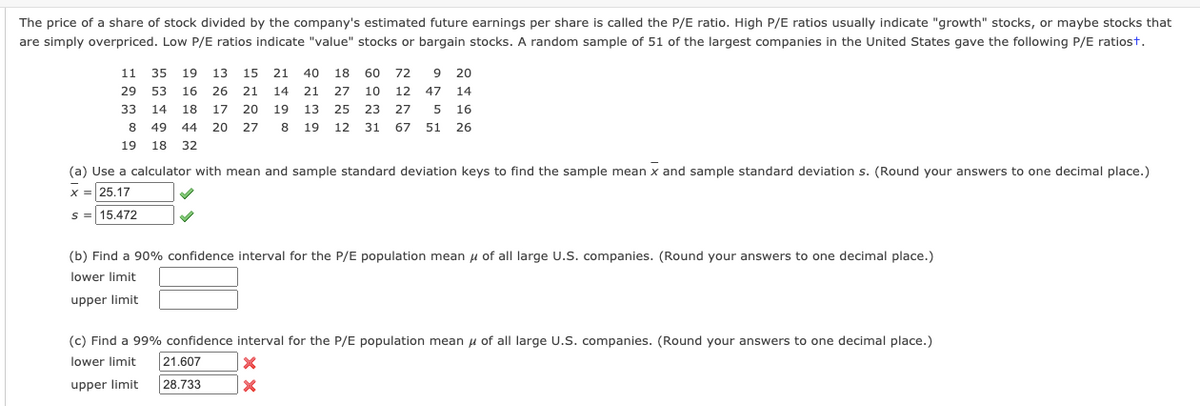
Transcribed Image Text:The price of a share of stock divided by the company's estimated future earnings per share is called the P/E ratio. High P/E ratios usually indicate "growth" stocks, or maybe stocks that
are simply overpriced. Low P/E ratios indicate "value" stocks or bargain stocks. A random sample of 51 of the largest companies in the United States gave the following P/E ratiost.
11 35 19
13 15 21 40
18 60 72
9 20
29
53
16
26 21 14
21 27
10
12
47
14
33
14
18
17 20 19
13 25 23 27
5 16
8 49
44
20 27
8 19
12 31 67 51 26
19 18 32
(a) Use a calculator with mean and sample standard deviation keys to find the sample mean x and sample standard deviation s. (Round your answers to one decimal place.)
x = 25.17
s = 15.472
(b) Find a 90% confidence interval for the P/E population mean u of all large U.S. companies. (Round your answers to one decimal place.)
lower limit
upper limit
(c) Find a 99% confidence interval for the P/E population mean u of all large U.S. companies. (Round your answers to one decimal place.)
lower limit
21.607
upper limit
28.733
Expert Solution
This question has been solved!
Explore an expertly crafted, step-by-step solution for a thorough understanding of key concepts.

This is a popular solution!

Trending now
This is a popular solution!

Step by step
Solved in 3 steps

Knowledge Booster


Learn more about
Need a deep-dive on the concept behind this application? Look no further. Learn more about this topic, statistics and related others by exploring similar questions and additional content below.Recommended textbooks for you
Functions and Change: A Modeling Approach to Coll…
Algebra
ISBN:
9781337111348
Author:
Bruce Crauder, Benny Evans, Alan Noell
Publisher:
Cengage Learning

Glencoe Algebra 1, Student Edition, 9780079039897…
Algebra
ISBN:
9780079039897
Author:
Carter
Publisher:
McGraw Hill
Functions and Change: A Modeling Approach to Coll…
Algebra
ISBN:
9781337111348
Author:
Bruce Crauder, Benny Evans, Alan Noell
Publisher:
Cengage Learning
Glencoe Algebra 1, Student Edition, 9780079039897…
Algebra
ISBN:
9780079039897
Author:
Carter
Publisher:
McGraw Hill