The price X (dollars per pound) and consumption y (in pounds per capita) of beef were samples for 10 randomly selected years. The following data should be used to answer the question that follows. n = 10 Ex = 36.19 Ex2 = 134.17 2.9 < x < 6.2 Ey = 36.19774.74 Zy2 = 60739.23 Exy = 2832.21 Using this data, a student calculated SSyy = 28.43 SSXX = 3.2 SSy= 717. ху Which one of the following represents the equation of the regression line between price and consumption
The price X (dollars per pound) and consumption y (in pounds per capita) of beef were samples for 10 randomly selected years. The following data should be used to answer the question that follows. n = 10 Ex = 36.19 Ex2 = 134.17 2.9 < x < 6.2 Ey = 36.19774.74 Zy2 = 60739.23 Exy = 2832.21 Using this data, a student calculated SSyy = 28.43 SSXX = 3.2 SSy= 717. ху Which one of the following represents the equation of the regression line between price and consumption

Glencoe Algebra 1, Student Edition, 9780079039897, 0079039898, 2018
18th Edition
ISBN:9780079039897
Author:Carter
Publisher:Carter
Chapter10: Statistics
Section10.1: Measures Of Center
Problem 9PPS

Related questions
Question
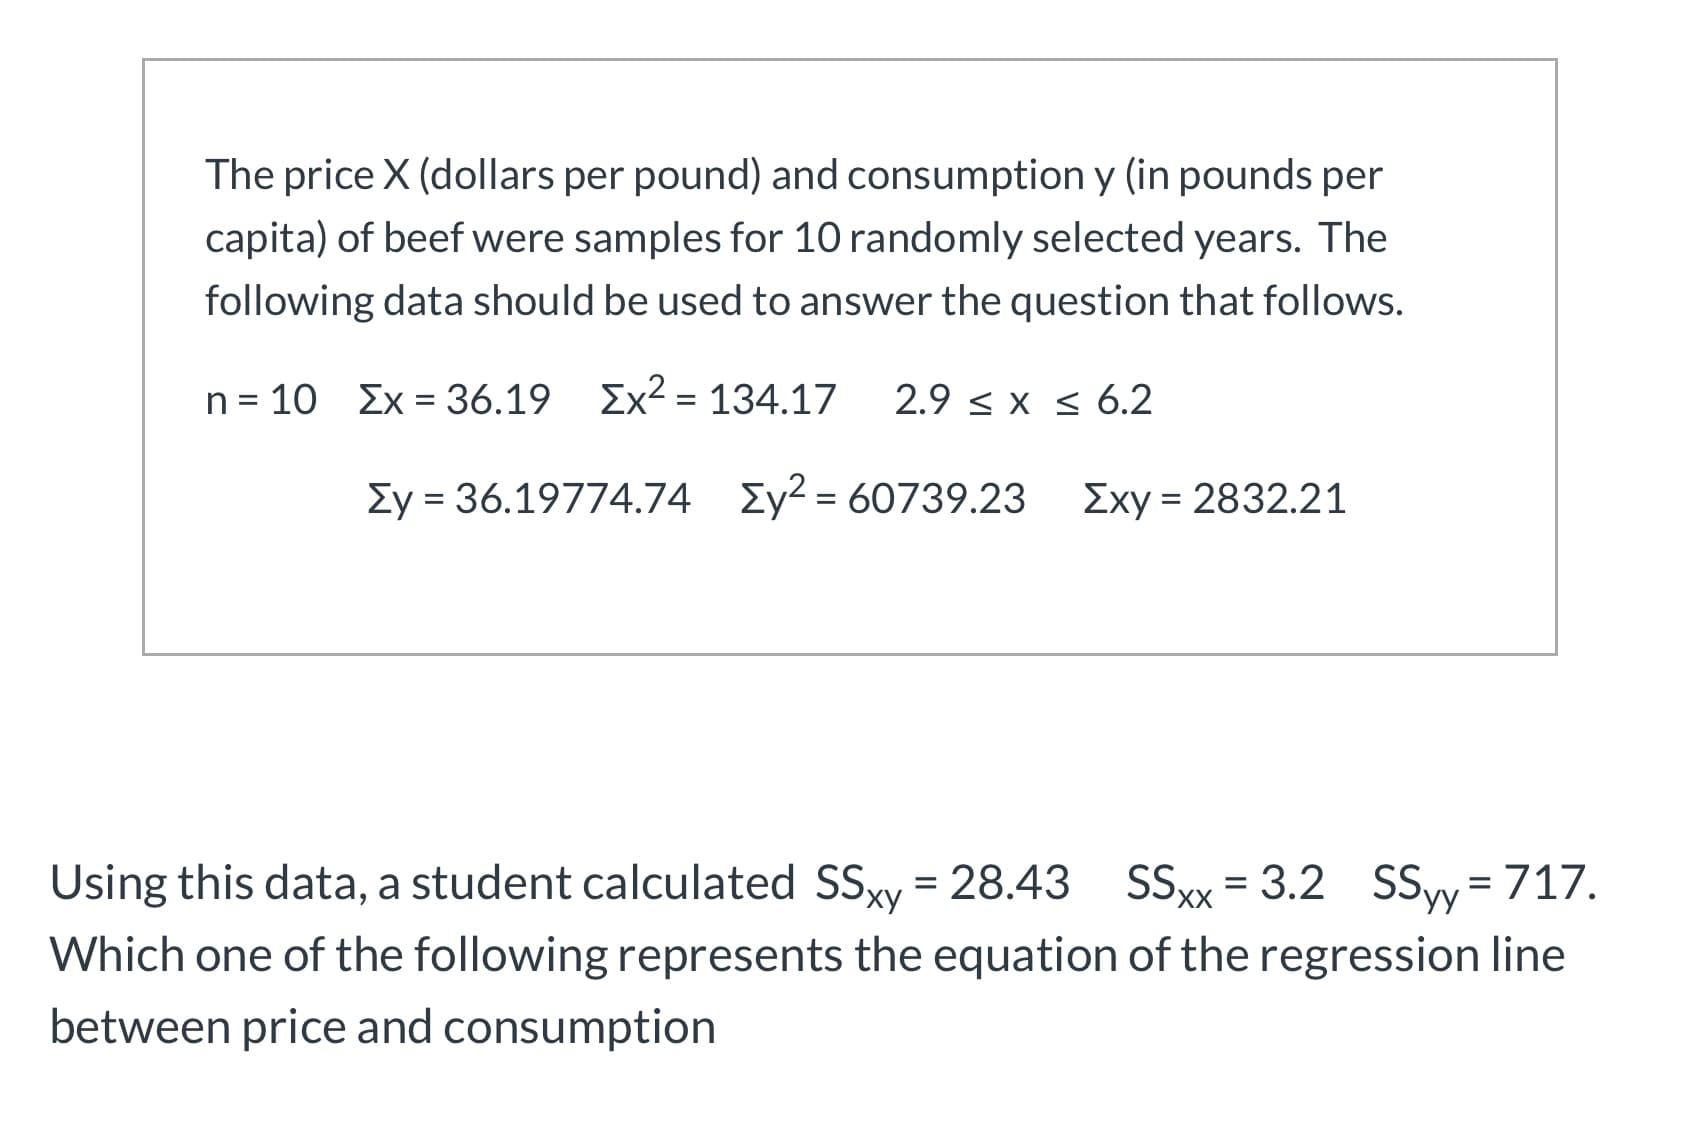
Transcribed Image Text:The price X (dollars per pound) and consumption y (in pounds per
capita) of beef were samples for 10 randomly selected years. The
following data should be used to answer the question that follows.
n = 10 Ex = 36.19 Ex2 = 134.17
2.9 < x < 6.2
Ey = 36.19774.74 Zy2 = 60739.23
Exy = 2832.21
Using this data, a student calculated SSyy = 28.43
SSXX = 3.2 SSy= 717.
ху
Which one of the following represents the equation of the regression line
between price and consumption
Expert Solution
This question has been solved!
Explore an expertly crafted, step-by-step solution for a thorough understanding of key concepts.

This is a popular solution!

Trending now
This is a popular solution!

Step by step
Solved in 5 steps with 4 images

Recommended textbooks for you
Glencoe Algebra 1, Student Edition, 9780079039897…
Algebra
ISBN:
9780079039897
Author:
Carter
Publisher:
McGraw Hill
Glencoe Algebra 1, Student Edition, 9780079039897…
Algebra
ISBN:
9780079039897
Author:
Carter
Publisher:
McGraw Hill