The researchers from a study interviewed two random samples, one in 2015 and one in 2018. Both samples were asked "Have you read a print book in the last Question Help year?" Use the accompanying results from the study to complete parts (a) through (c). Read a print book 2015 2018 Total Yes 1195 726 1921 1372 605 1977 2567 No 1331 Total a Find and compare the sample proportions that had read a print book for these two groups. The sample proportion of the 2015 subjects that read a book within the last year is 622 The sample proportion of the 2018 subjects that read a book within the last year is 694. (Round to four decimal places as needed.) The sample proportion for 2015 is less than the sample proportion for 2018. b. Find a pooled estimate of the sample proportion. A pooled estimate of the sample proportion is (Round to four decimal places as needed) c. Has the proportion who read print books increased? Find the observed value of the test statistic to test the hypotheses Ho P, = P2 and H, P,
The researchers from a study interviewed two random samples, one in 2015 and one in 2018. Both samples were asked "Have you read a print book in the last Question Help year?" Use the accompanying results from the study to complete parts (a) through (c). Read a print book 2015 2018 Total Yes 1195 726 1921 1372 605 1977 2567 No 1331 Total a Find and compare the sample proportions that had read a print book for these two groups. The sample proportion of the 2015 subjects that read a book within the last year is 622 The sample proportion of the 2018 subjects that read a book within the last year is 694. (Round to four decimal places as needed.) The sample proportion for 2015 is less than the sample proportion for 2018. b. Find a pooled estimate of the sample proportion. A pooled estimate of the sample proportion is (Round to four decimal places as needed) c. Has the proportion who read print books increased? Find the observed value of the test statistic to test the hypotheses Ho P, = P2 and H, P,

College Algebra (MindTap Course List)
12th Edition
ISBN:9781305652231
Author:R. David Gustafson, Jeff Hughes
Publisher:R. David Gustafson, Jeff Hughes
Chapter8: Sequences, Series, And Probability
Section8.7: Probability
Problem 5E: List the sample space of each experiment. Rolling one die and tossing one coin

Related questions

Topic Video
Question
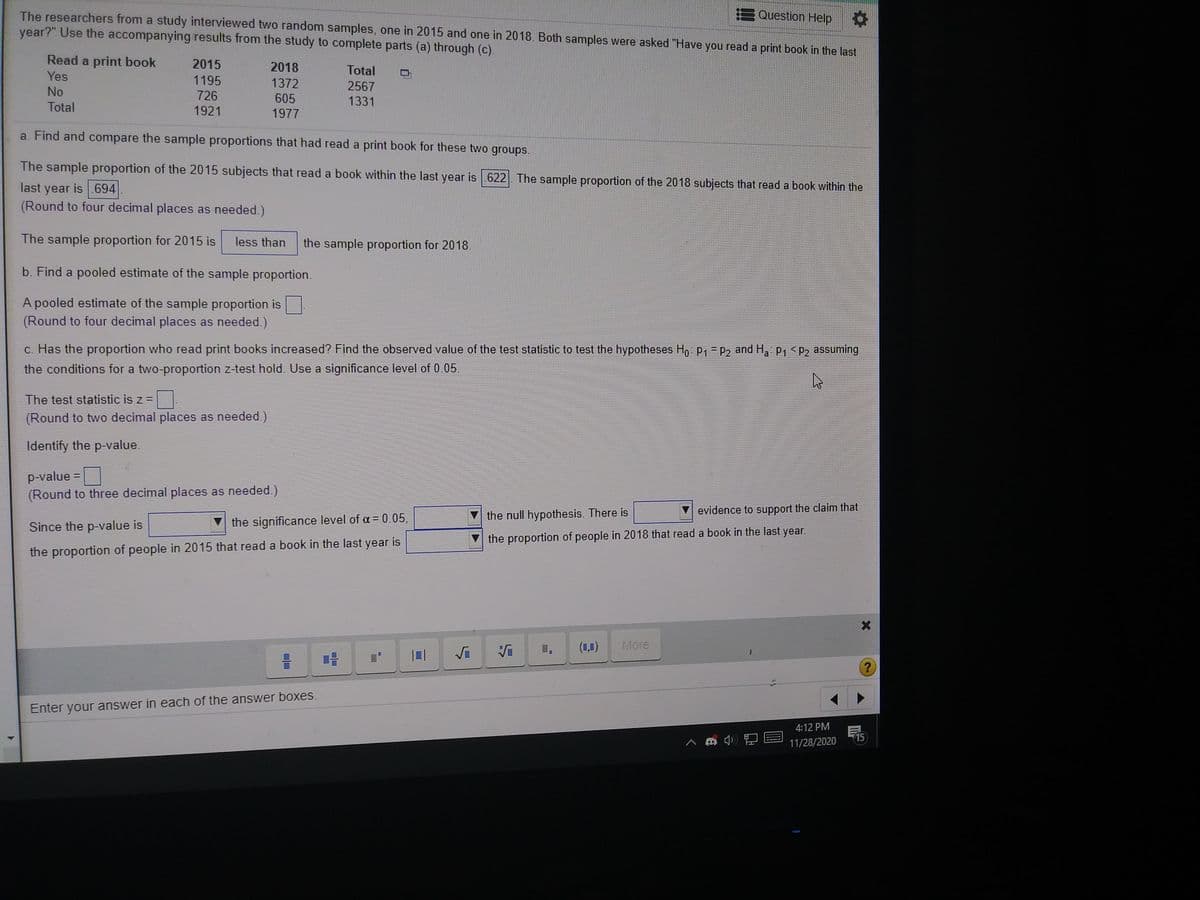
Transcribed Image Text:The researchers from a study interviewed two random samples, one in 2015 and one in 2018. Both samples were asked "Have you read a print book in the last
Question Help
year?" Use the accompanying results from the study to complete parts (a) through (c).
Read a print book
2015
2018
Total
Yes
1195
726
1372
2567
No
605
1331
Total
1921
1977
a. Find and compare the sample proportions that had read a print book for these two groups.
The sample proportion of the 2015 subjects that read a book within the last year is 622. The sample proportion of the 2018 subjects that read a book within the
last year is 694
(Round to four decimal places as needed.)
The sample proportion for 2015 is
less than
the sample proportion for 2018.
b. Find a pooled estimate of the sample proportion.
A pooled estimate of the sample proportion is
(Round to four decimal places as needed.)
c. Has the proportion who read print books increased? Find the observed value of the test statistic to test the hypotheses H, p, - P2 and H, p,<P2 assuming
the conditions for a two-proportion z-test hold. Use a significance level of 0.05.
The test statistic is z =
(Round to two decimal places as needed.)
Identify the p-value.
p-value =
%3D
(Round to three decimal places as needed.)
the null hypothesis. There is
evidence to support the claim that
Since the p-value is
the significance level of a = 0.05,
V the proportion of people in 2018 that read a book in the last year.
the proportion of people in 2015 that read a book in the last year is
(1,1)
More
Enter your answer in each of the answer boxes.
4:12 PM
715
ヘ8 門
11/28/2020
Expert Solution
This question has been solved!
Explore an expertly crafted, step-by-step solution for a thorough understanding of key concepts.

This is a popular solution!

Trending now
This is a popular solution!

Step by step
Solved in 2 steps

Knowledge Booster


Learn more about
Need a deep-dive on the concept behind this application? Look no further. Learn more about this topic, statistics and related others by exploring similar questions and additional content below.Recommended textbooks for you
College Algebra (MindTap Course List)
Algebra
ISBN:
9781305652231
Author:
R. David Gustafson, Jeff Hughes
Publisher:
Cengage Learning
College Algebra (MindTap Course List)
Algebra
ISBN:
9781305652231
Author:
R. David Gustafson, Jeff Hughes
Publisher:
Cengage Learning