The scatterplot illustrates the relationship between high school and college GPAS for a sample of Which of the following is an accurate description of the scatterplot? students. Relationship between High School and College GPAS O Students with higher high school GPAS have higher college GPAS. O tudents with lower high school GPAS repeat their performance and get low college GPAS. 4.0 O Because college is a fresh start, there is no 3.8 relationship between high school and college 3.6 GPAS. Lower high school GPAS correlate to lower college 3.4 GPAS, with one exception of a low high school GPA 3.2 and high college GPA. 3.0 2.8 2.00 2.25 2.50 2.75 3.00 3.25 3.50 3.75 4.00 HS GPA College GPA
The scatterplot illustrates the relationship between high school and college GPAS for a sample of Which of the following is an accurate description of the scatterplot? students. Relationship between High School and College GPAS O Students with higher high school GPAS have higher college GPAS. O tudents with lower high school GPAS repeat their performance and get low college GPAS. 4.0 O Because college is a fresh start, there is no 3.8 relationship between high school and college 3.6 GPAS. Lower high school GPAS correlate to lower college 3.4 GPAS, with one exception of a low high school GPA 3.2 and high college GPA. 3.0 2.8 2.00 2.25 2.50 2.75 3.00 3.25 3.50 3.75 4.00 HS GPA College GPA

Glencoe Algebra 1, Student Edition, 9780079039897, 0079039898, 2018
18th Edition
ISBN:9780079039897
Author:Carter
Publisher:Carter
Chapter4: Equations Of Linear Functions
Section4.5: Correlation And Causation
Problem 15PPS

Related questions
Question
Question linked as a picture!
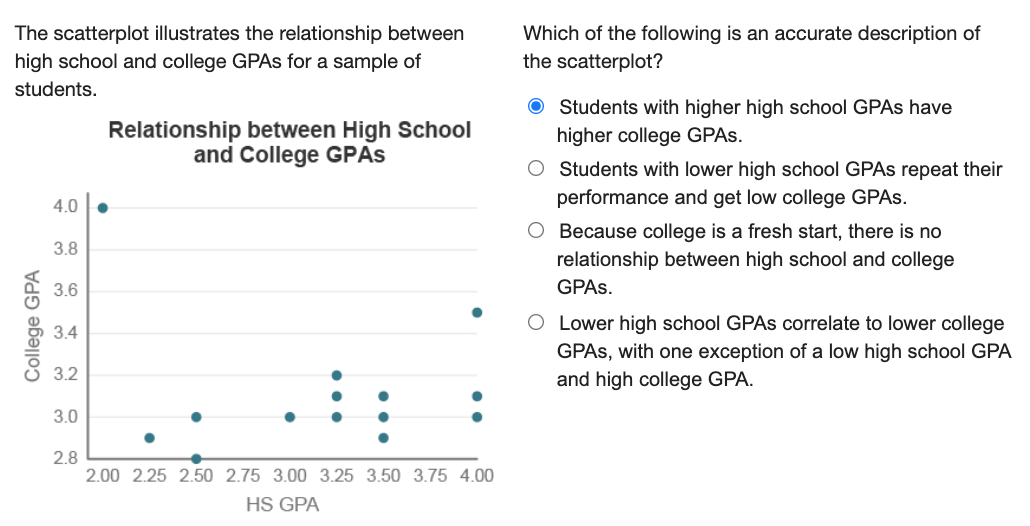
Transcribed Image Text:The scatterplot illustrates the relationship between
Which of the following is an accurate description of
the scatterplot?
high school and college GPAS for a sample of
students.
Relationship between High School
and College GPAS
O Students with higher high school GPAS have
higher college GPAS.
O Students with lower high school GPAS repeat their
performance and get low college GPAS.
4.0
O Because college is a fresh start, there is no
3.8
relationship between high school and college
3.6
GPAS.
O Lower high school GPAS correlate to lower college
3.4
GPAS, with one exception of a low high school GPA
3.2
and high college GPA.
3.0
2.8
2.00 2.25 2.50 2.75 3.00 3.25 3.50 3.75 4.00
HS GPA
College GPA
Expert Solution
This question has been solved!
Explore an expertly crafted, step-by-step solution for a thorough understanding of key concepts.

This is a popular solution!

Trending now
This is a popular solution!

Step by step
Solved in 2 steps with 1 images

Recommended textbooks for you
Glencoe Algebra 1, Student Edition, 9780079039897…
Algebra
ISBN:
9780079039897
Author:
Carter
Publisher:
McGraw Hill
Glencoe Algebra 1, Student Edition, 9780079039897…
Algebra
ISBN:
9780079039897
Author:
Carter
Publisher:
McGraw Hill