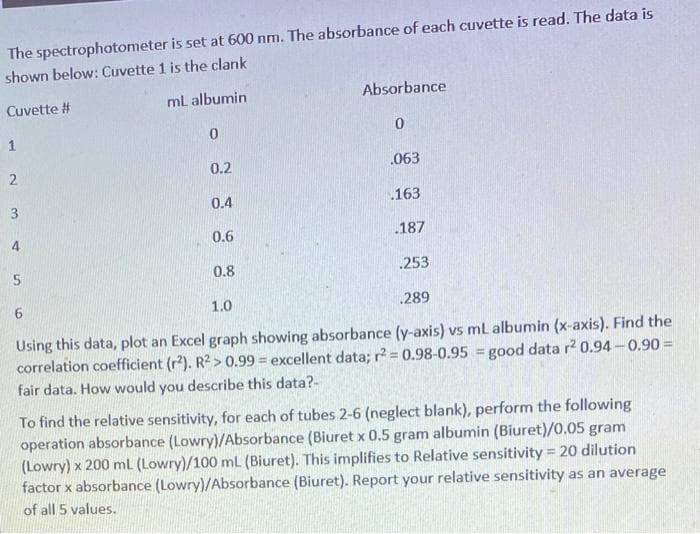
The spectrophotometer is set at 600 nm. The absorbance of each cuvette is read. The data is shown below: Cuvette 1 is the clank Cuvette # ml albumin Absorbance 1 2 0.2 .063 3 0.4 163 4. 0.6 .187 0.8 .253 1.0 .289 Using this data, plot an Excel graph showing absorbance (y-axis) vs ml albumin (x-axis). Find the correlation coefficient (r). R2 > 0.99 excellent data; r2 0.98-0.95 good data r2 0.94-0.90 = fair data. How would you describe this data?-
The spectrophotometer is set at 600 nm. The absorbance of each cuvette is read. The data is shown below: Cuvette 1 is the clank Cuvette # ml albumin Absorbance 1 2 0.2 .063 3 0.4 163 4. 0.6 .187 0.8 .253 1.0 .289 Using this data, plot an Excel graph showing absorbance (y-axis) vs ml albumin (x-axis). Find the correlation coefficient (r). R2 > 0.99 excellent data; r2 0.98-0.95 good data r2 0.94-0.90 = fair data. How would you describe this data?-

Principles of Instrumental Analysis
7th Edition
ISBN:9781305577213
Author:Douglas A. Skoog, F. James Holler, Stanley R. Crouch
Publisher:Douglas A. Skoog, F. James Holler, Stanley R. Crouch
Chapter14: Applications Of Ultraviolet-visible Molecular Absorption Spectrometry
Section: Chapter Questions
Problem 14.12QAP

Related questions
Question
100%
Transcribed Image Text:The spectrophotometer is set at 600 nm. The absorbance of each cuvette is read. The data is
shown below: Cuvette 1 is the clank
Cuvette #
ml albumin
Absorbance
0.
0.2
.063
3
0.4
.163
4.
0.6
.187
0.8
.253
1.0
.289
Using this data, plot an Excel graph showing absorbance (y-axis) vs ml albumin (x-axis). Find the
correlation coefficient (r). R2 > 0.99 = excellent data; r2 0.98-0.95 good data r2 0.94 -0.90 =
fair data. How would you describe this data?-
To find the relative sensitivity, for each of tubes 2-6 (neglect blank), perform the following
operation absorbance (Lowry)/Absorbance (Biuret x 0.5 gram albumin (Biuret)/0.05 gram
(Lowry) x 200 ml (Lowry)/100 mL (Biuret). This implifies to Relative sensitivity = 20 dilution
factor x absorbance (Lowry)/Absorbance (Biuret). Report your relative sensitivity as an average
of all 5 values.
Expert Solution
This question has been solved!
Explore an expertly crafted, step-by-step solution for a thorough understanding of key concepts.

Step by step
Solved in 3 steps with 3 images

Knowledge Booster


Learn more about
Need a deep-dive on the concept behind this application? Look no further. Learn more about this topic, chemistry and related others by exploring similar questions and additional content below.Recommended textbooks for you
Principles of Instrumental Analysis
Chemistry
ISBN:
9781305577213
Author:
Douglas A. Skoog, F. James Holler, Stanley R. Crouch
Publisher:
Cengage Learning

Principles of Instrumental Analysis
Chemistry
ISBN:
9781305577213
Author:
Douglas A. Skoog, F. James Holler, Stanley R. Crouch
Publisher:
Cengage Learning

Chemistry & Chemical Reactivity
Chemistry
ISBN:
9781337399074
Author:
John C. Kotz, Paul M. Treichel, John Townsend, David Treichel
Publisher:
Cengage Learning

Chemistry & Chemical Reactivity
Chemistry
ISBN:
9781133949640
Author:
John C. Kotz, Paul M. Treichel, John Townsend, David Treichel
Publisher:
Cengage Learning