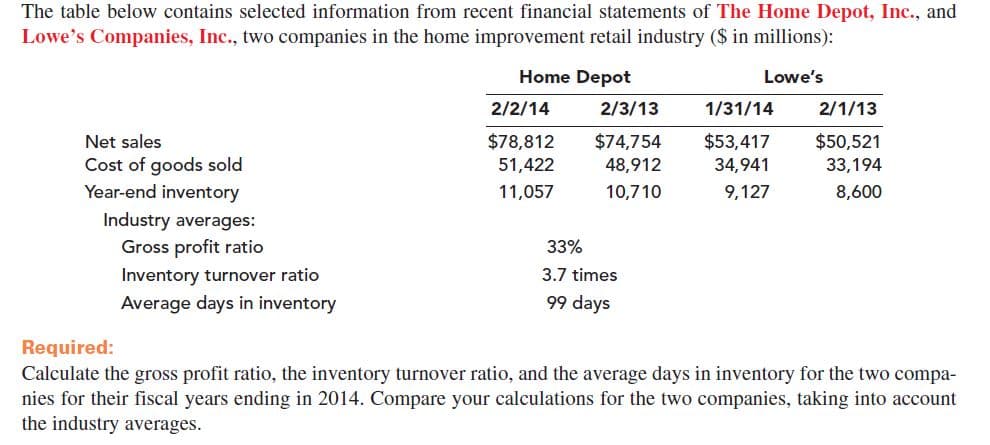
The table below contains selected information from recent financial statements of The Home Depot, Inc., and Lowe's Companies, Inc., two companies in the home improvement retail industry ($ in millions): Home Depot Lowe's 2/2/14 2/3/13 1/31/14 2/1/13 $78,812 $74,754 $53,417 $50,521 33,194 Net sales Cost of goods sold Year-end inventory 51,422 48,912 34,941 11,057 10,710 9,127 8,600 Industry averages: Gross profit ratio 33% Inventory turnover ratio 3.7 times 99 days Average days in inventory Required: Calculate the gross profit ratio, the inventory turnover ratio, and the average days in inventory for the two compa- nies for their fiscal years ending in 2014. Compare your calculations for the two companies, taking into account the industry averages.
The table below contains selected information from recent financial statements of The Home Depot, Inc., and Lowe's Companies, Inc., two companies in the home improvement retail industry ($ in millions): Home Depot Lowe's 2/2/14 2/3/13 1/31/14 2/1/13 $78,812 $74,754 $53,417 $50,521 33,194 Net sales Cost of goods sold Year-end inventory 51,422 48,912 34,941 11,057 10,710 9,127 8,600 Industry averages: Gross profit ratio 33% Inventory turnover ratio 3.7 times 99 days Average days in inventory Required: Calculate the gross profit ratio, the inventory turnover ratio, and the average days in inventory for the two compa- nies for their fiscal years ending in 2014. Compare your calculations for the two companies, taking into account the industry averages.

Managerial Accounting: The Cornerstone of Business Decision-Making
7th Edition
ISBN:9781337115773
Author:Maryanne M. Mowen, Don R. Hansen, Dan L. Heitger
Publisher:Maryanne M. Mowen, Don R. Hansen, Dan L. Heitger
Chapter15: Financial Statement Analysis
Section: Chapter Questions
Problem 56P: The following selected information is taken from the financial statements of Arnn Company for its...

Related questions
Question
Transcribed Image Text:The table below contains selected information from recent financial statements of The Home Depot, Inc., and
Lowe's Companies, Inc., two companies in the home improvement retail industry ($ in millions):
Home Depot
Lowe's
2/2/14
2/3/13
1/31/14
2/1/13
$78,812
$74,754
$53,417
$50,521
33,194
Net sales
Cost of goods sold
Year-end inventory
51,422
48,912
34,941
11,057
10,710
9,127
8,600
Industry averages:
Gross profit ratio
33%
Inventory turnover ratio
3.7 times
99 days
Average days in inventory
Required:
Calculate the gross profit ratio, the inventory turnover ratio, and the average days in inventory for the two compa-
nies for their fiscal years ending in 2014. Compare your calculations for the two companies, taking into account
the industry averages.
Expert Solution
This question has been solved!
Explore an expertly crafted, step-by-step solution for a thorough understanding of key concepts.

This is a popular solution!

Trending now
This is a popular solution!

Step by step
Solved in 3 steps with 2 images

Recommended textbooks for you
Managerial Accounting: The Cornerstone of Busines…
Accounting
ISBN:
9781337115773
Author:
Maryanne M. Mowen, Don R. Hansen, Dan L. Heitger
Publisher:
Cengage Learning

Cornerstones of Financial Accounting
Accounting
ISBN:
9781337690881
Author:
Jay Rich, Jeff Jones
Publisher:
Cengage Learning

Survey of Accounting (Accounting I)
Accounting
ISBN:
9781305961883
Author:
Carl Warren
Publisher:
Cengage Learning
Managerial Accounting: The Cornerstone of Busines…
Accounting
ISBN:
9781337115773
Author:
Maryanne M. Mowen, Don R. Hansen, Dan L. Heitger
Publisher:
Cengage Learning
Cornerstones of Financial Accounting
Accounting
ISBN:
9781337690881
Author:
Jay Rich, Jeff Jones
Publisher:
Cengage Learning
Survey of Accounting (Accounting I)
Accounting
ISBN:
9781305961883
Author:
Carl Warren
Publisher:
Cengage Learning

Financial And Managerial Accounting
Accounting
ISBN:
9781337902663
Author:
WARREN, Carl S.
Publisher:
Cengage Learning,

Financial Accounting
Accounting
ISBN:
9781337272124
Author:
Carl Warren, James M. Reeve, Jonathan Duchac
Publisher:
Cengage Learning

Financial Accounting
Accounting
ISBN:
9781305088436
Author:
Carl Warren, Jim Reeve, Jonathan Duchac
Publisher:
Cengage Learning