The table below shows worldwide smart phone sales by vendor. Worldwide Smartphone Sales to End Users by Vor in 1Q13 (Thousands of Units): Q1 2013 Shipments Shipments 64,740.0 38,331.8 Vendor Q1 2012 Samsung Apple LG Technologies Huawei Technologies ZTE Others Total 40,612.8 33.120.5 10,080.4 9.334.2 4,961.4 5.269.6 7,883.3 79,676.4 210,046.1 4,518.9 58.537.0 147.020.2 Based on the information in the table, which of the following statements is supported by the deta? None of the five top vendors had a clecrease in market share from Q1 2012 to Q1 2013. Samsung and Apple represented about 60% of the worldwide sales during Q1 2012 Samsung sales increased by about 15% from Q1 2012 to Q1 2013. Apple's market shere fell about 4% from 2012 to 2013.
The table below shows worldwide smart phone sales by vendor. Worldwide Smartphone Sales to End Users by Vor in 1Q13 (Thousands of Units): Q1 2013 Shipments Shipments 64,740.0 38,331.8 Vendor Q1 2012 Samsung Apple LG Technologies Huawei Technologies ZTE Others Total 40,612.8 33.120.5 10,080.4 9.334.2 4,961.4 5.269.6 7,883.3 79,676.4 210,046.1 4,518.9 58.537.0 147.020.2 Based on the information in the table, which of the following statements is supported by the deta? None of the five top vendors had a clecrease in market share from Q1 2012 to Q1 2013. Samsung and Apple represented about 60% of the worldwide sales during Q1 2012 Samsung sales increased by about 15% from Q1 2012 to Q1 2013. Apple's market shere fell about 4% from 2012 to 2013.

Algebra and Trigonometry (6th Edition)
6th Edition
ISBN:9780134463216
Author:Robert F. Blitzer
Publisher:Robert F. Blitzer
ChapterP: Prerequisites: Fundamental Concepts Of Algebra
Section: Chapter Questions
Problem 1MCCP: In Exercises 1-25, simplify the given expression or perform the indicated operation (and simplify,...

Related questions
Question
Based on the information in the table which of the following statements is
supported by the data
Transcribed Image Text:County
OOdysseyware
https://christianaps.owschools.com/owsoo/studentAssignment/index?eh=D935236563
Assignment - 9. Observational Studies
Attempt 1 of 2
ASSIGNMENTS
COURSES
SEC
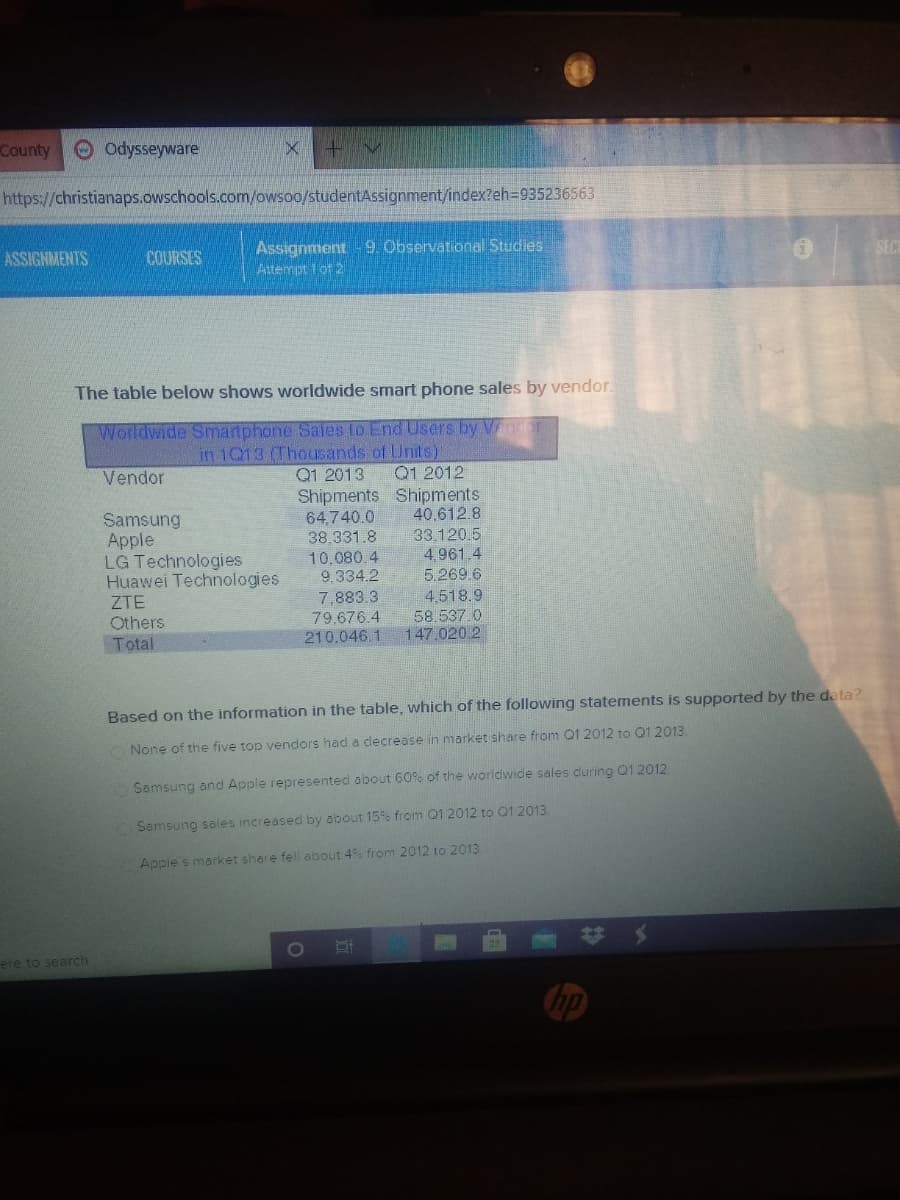
The table below shows worldwide smart phone sales by vendor.
Worldwide Smartphone Sales to End Users by Vn
in 1Q13 (Thousands of Units):
Q1 2012
Shipments Shipments
40,612.8
33.120.5
4,961.4
5.269.6
Vendor
Q1 2013
Samsung
Apple
LG Technologies
Huawei Technologies
64,740.0
38.331.8
10,080.4
9.334.2
4,518.9
ZTE
Others
7,883.3
79.676.4
210,046.1
58.537.0
147.020 2
Total
Based on the information in the table, which of the following statements is supported by the data?
O None of the five top vendors had a decrease in market share from Q1 2012 to Q1 2013
Samsung and Apple represented about 60% of the worldwicde sales during Q1 2012
Samsung sales increased by about 15% from Q1 2012 to 01 2013.
Apple's market share fell about 4% from 2012 to 2013.
ere to search
Expert Solution
This question has been solved!
Explore an expertly crafted, step-by-step solution for a thorough understanding of key concepts.

This is a popular solution!

Trending now
This is a popular solution!

Step by step
Solved in 2 steps with 1 images

Knowledge Booster


Learn more about
Need a deep-dive on the concept behind this application? Look no further. Learn more about this topic, algebra and related others by exploring similar questions and additional content below.Recommended textbooks for you
Algebra and Trigonometry (6th Edition)
Algebra
ISBN:
9780134463216
Author:
Robert F. Blitzer
Publisher:
PEARSON

Contemporary Abstract Algebra
Algebra
ISBN:
9781305657960
Author:
Joseph Gallian
Publisher:
Cengage Learning

Linear Algebra: A Modern Introduction
Algebra
ISBN:
9781285463247
Author:
David Poole
Publisher:
Cengage Learning
Algebra and Trigonometry (6th Edition)
Algebra
ISBN:
9780134463216
Author:
Robert F. Blitzer
Publisher:
PEARSON
Contemporary Abstract Algebra
Algebra
ISBN:
9781305657960
Author:
Joseph Gallian
Publisher:
Cengage Learning
Linear Algebra: A Modern Introduction
Algebra
ISBN:
9781285463247
Author:
David Poole
Publisher:
Cengage Learning

Algebra And Trigonometry (11th Edition)
Algebra
ISBN:
9780135163078
Author:
Michael Sullivan
Publisher:
PEARSON

Introduction to Linear Algebra, Fifth Edition
Algebra
ISBN:
9780980232776
Author:
Gilbert Strang
Publisher:
Wellesley-Cambridge Press

College Algebra (Collegiate Math)
Algebra
ISBN:
9780077836344
Author:
Julie Miller, Donna Gerken
Publisher:
McGraw-Hill Education