The table below summarizes data from a survey of a sample of women. Using a 0.05 significance level, and assuming that the sample sizes of 900 men and 300 women are predetermined, test the claim that the proportions of agreeldisagree responses are the same for subjects interviewed by men and the subjects interviewed by women. Does it appear that the gender of the interviewer affected the responses of women? Gender of Interviewer Woman 247 53 Man Women who agree Women who disagree 308 Click here to view the chi-square distribution table. Identify the null and alternative hypotheses. Choose the correct answer below. O A. Hg: The response of the subject and the gender of the subject are independent. H: The response of the subject and the gender of the subject are dependent. B. Hg: The proportions of agreeldisagree responses are the same for the subjects interviewed by men and the subjects interviewed by women. H: The proportions are different. OC. Hg: The proportions of agreeldisagree responses are different for the subjects interviewed by men and the subjects interviewed by women. H: The proportions are the same. Compute the test statistic. 2१ 320
The table below summarizes data from a survey of a sample of women. Using a 0.05 significance level, and assuming that the sample sizes of 900 men and 300 women are predetermined, test the claim that the proportions of agreeldisagree responses are the same for subjects interviewed by men and the subjects interviewed by women. Does it appear that the gender of the interviewer affected the responses of women? Gender of Interviewer Woman 247 53 Man Women who agree Women who disagree 308 Click here to view the chi-square distribution table. Identify the null and alternative hypotheses. Choose the correct answer below. O A. Hg: The response of the subject and the gender of the subject are independent. H: The response of the subject and the gender of the subject are dependent. B. Hg: The proportions of agreeldisagree responses are the same for the subjects interviewed by men and the subjects interviewed by women. H: The proportions are different. OC. Hg: The proportions of agreeldisagree responses are different for the subjects interviewed by men and the subjects interviewed by women. H: The proportions are the same. Compute the test statistic. 2१ 320

Glencoe Algebra 1, Student Edition, 9780079039897, 0079039898, 2018
18th Edition
ISBN:9780079039897
Author:Carter
Publisher:Carter
Chapter10: Statistics
Section10.4: Distributions Of Data
Problem 19PFA

Related questions

Topic Video
Question
Transcribed Image Text:11.2.7
Question Help
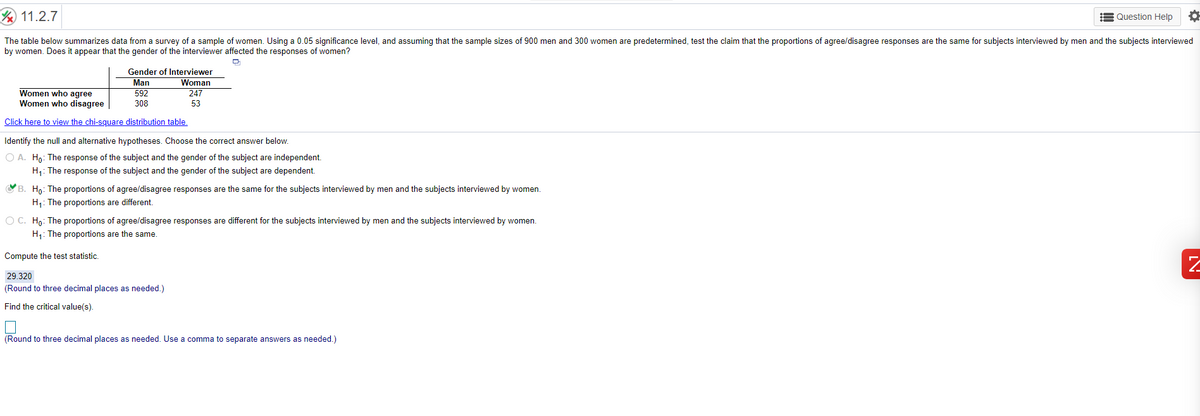
The table below summarizes data from a survey of a sample of women. Using a 0.05 significance level, and assuming that the sample sizes of 900 men and 300 women are predetermined, test the claim that the proportions of agree/disagree responses are the same for subjects interviewed by men and the subjects interviewed
by women. Does it appear that the gender of the interviewer affected the responses of women?
Gender of Interviewer
Man
Woman
Women who agree
Women who disagree
592
247
308
53
Click here to view the chi-square distribution table.
Identify the null and alternative hypotheses. Choose the correct answer below.
O A. Ho: The response of the subject and the gender of the subject are independent.
H1: The response of the subject and the gender of the subject are dependent.
B. Ho: The proportions of agree/disagree responses are the same for the subjects interviewed by men and the subjects interviewed by women.
H1: The proportions are different.
O C. Ho: The proportions of agree/disagree responses are different for the subjects interviewed by men and the subjects interviewed by women.
H1: The proportions are the same.
Compute the test statistic.
29.320
(Round to three decimal places as needed.)
Find the critical value(s).
(Round to three decimal places as needed. Use a comma to separate answers as needed.)
Expert Solution
This question has been solved!
Explore an expertly crafted, step-by-step solution for a thorough understanding of key concepts.

This is a popular solution!

Trending now
This is a popular solution!

Step by step
Solved in 2 steps

Knowledge Booster


Learn more about
Need a deep-dive on the concept behind this application? Look no further. Learn more about this topic, statistics and related others by exploring similar questions and additional content below.Recommended textbooks for you
Glencoe Algebra 1, Student Edition, 9780079039897…
Algebra
ISBN:
9780079039897
Author:
Carter
Publisher:
McGraw Hill
Glencoe Algebra 1, Student Edition, 9780079039897…
Algebra
ISBN:
9780079039897
Author:
Carter
Publisher:
McGraw Hill