The table displays the distribution of the percentage of different types of home heating sources for a large mountain city, as reported by the city newspaper. Type of Heating Source Wood Stove Electric Propane/Gas Solar Radiant Floor Percent 38% 26% 20% 16% A chi-square goodness-of-fit test will be performed using a simple random sample of 100 homes to investigate whether the proportion of homes heated with each source is the same as what is reported by the newspaper. Which of the following represents the alternative hypothesis of the test? A The proportions for the different heating systems match those reported by the newspaper. At least one of the heating source proportions is the same as the corresponding proportion reported by the newspaper. The heating sources are not evenly distributed between homes. D. At least one of the heating source proportions is different from the proportion reported by the newspaper. E Wood stove heating represents the highest proportion of heating source.
The table displays the distribution of the percentage of different types of home heating sources for a large mountain city, as reported by the city newspaper. Type of Heating Source Wood Stove Electric Propane/Gas Solar Radiant Floor Percent 38% 26% 20% 16% A chi-square goodness-of-fit test will be performed using a simple random sample of 100 homes to investigate whether the proportion of homes heated with each source is the same as what is reported by the newspaper. Which of the following represents the alternative hypothesis of the test? A The proportions for the different heating systems match those reported by the newspaper. At least one of the heating source proportions is the same as the corresponding proportion reported by the newspaper. The heating sources are not evenly distributed between homes. D. At least one of the heating source proportions is different from the proportion reported by the newspaper. E Wood stove heating represents the highest proportion of heating source.

Glencoe Algebra 1, Student Edition, 9780079039897, 0079039898, 2018
18th Edition
ISBN:9780079039897
Author:Carter
Publisher:Carter
Chapter10: Statistics
Section: Chapter Questions
Problem 13PT

Related questions

Question
Transcribed Image Text:1.
2
4
6.
7
8.
9.
10
11)
(12)
13
14
15)
(16
Question 4
口
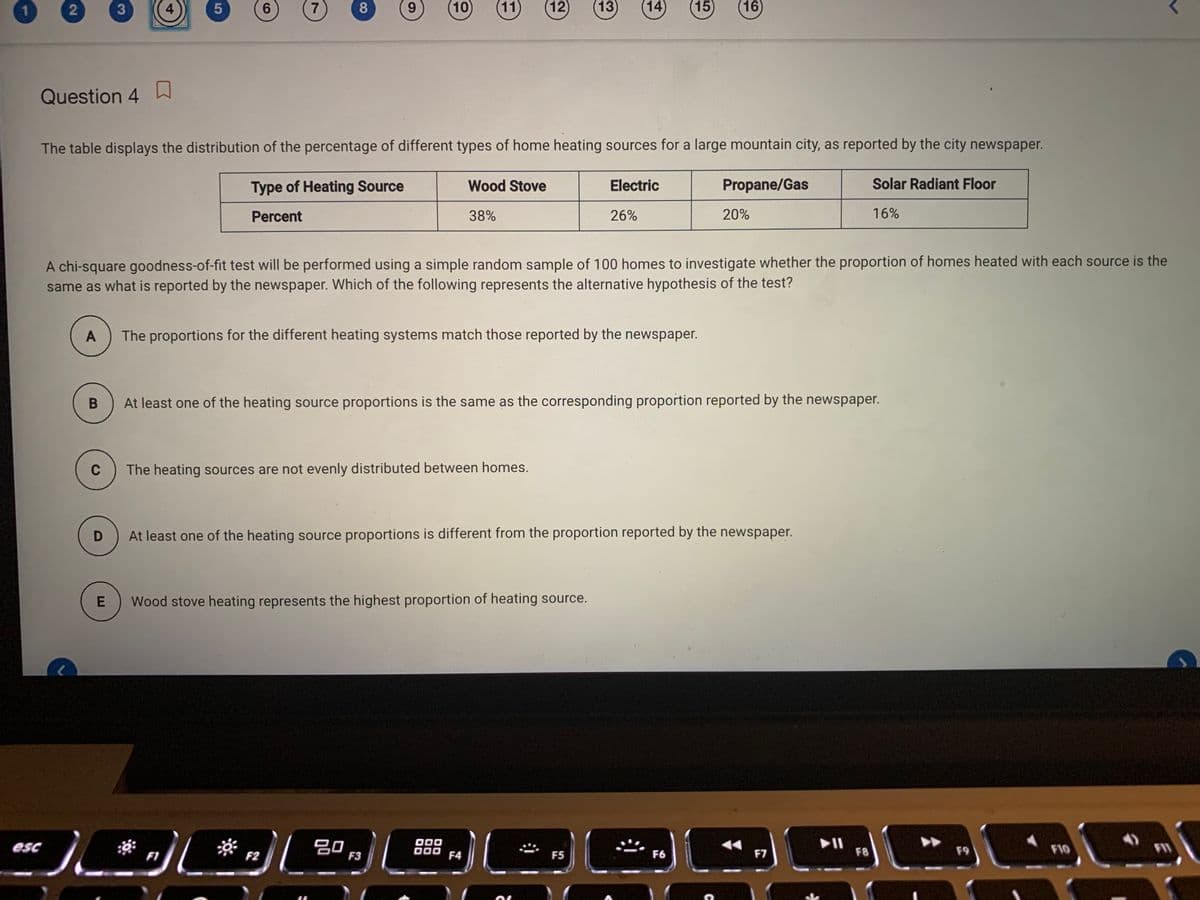
The table displays the distribution of the percentage of different types of home heating sources for a large mountain city, as reported by the city newspaper.
Type of Heating Source
Wood Stove
Electric
Propane/Gas
Solar Radiant Floor
Percent
38%
26%
20%
16%
A chi-square goodness-of-fit test will be performed using a simple random sample of 100 homes to investigate whether the proportion of homes heated with each source is the
same as what is reported by the newspaper. Which of the following represents the alternative hypothesis of the test?
A
The proportions for the different heating systems match those reported by the newspaper.
B
At least one of the heating source proportions is the same as the corresponding proportion reported by the newspaper.
C
The heating sources are not evenly distributed between homes.
At least one of the heating source proportions is different from the proportion reported by the newspaper.
Wood stove heating represents the highest proportion of heating source.
儿*sD .
吕口
F3
O00
D00
II
F8
esc
F9
F10
FI1
F1
F2
F4
F5
F6
F7
CO
5
Transcribed Image Text:Question 6
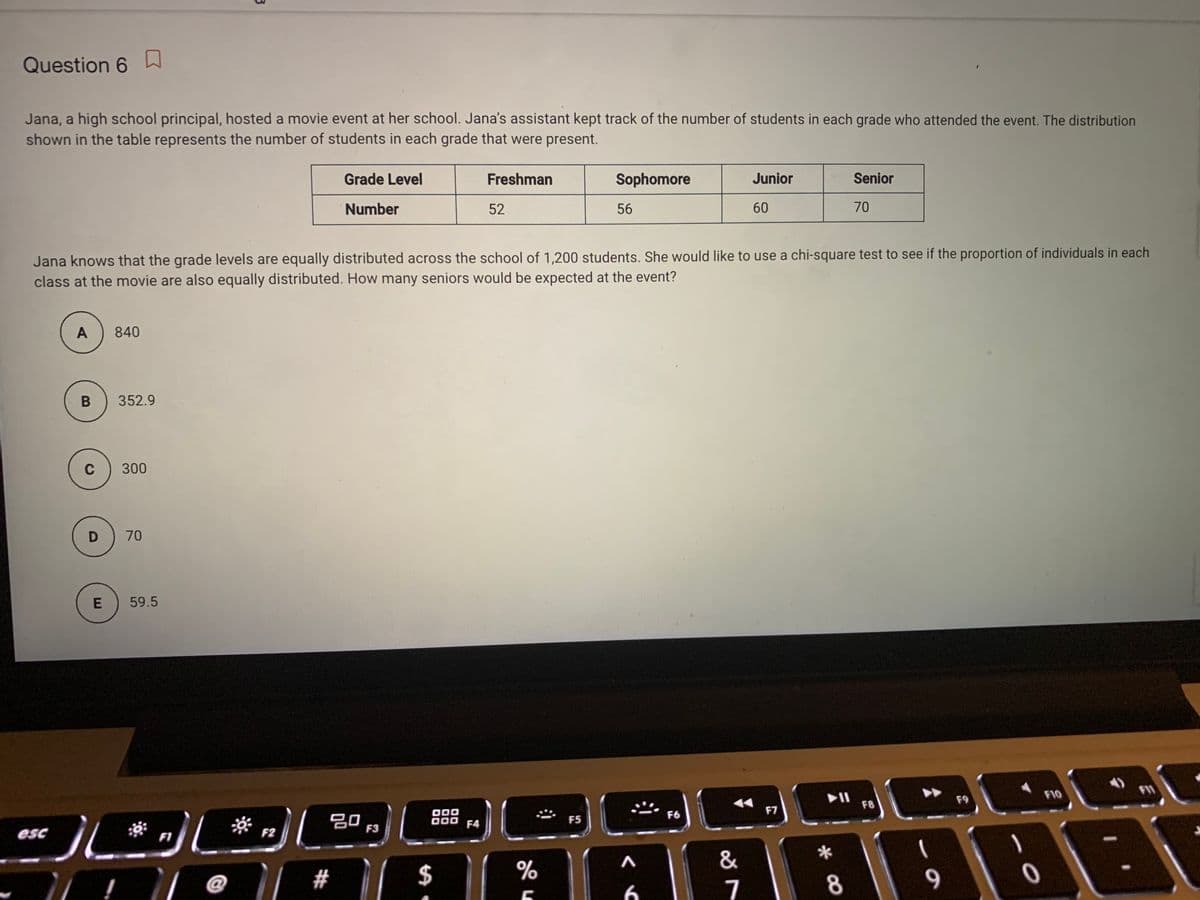
Jana, a high school principal, hosted a movie event at her school. Jana's assistant kept track of the number of students in each grade who attended the event. The distribution
shown in the table represents the number of students in each grade that were present.
Grade Level
Freshman
Sophomore
Junior
Senior
Number
52
56
60
70
Jana knows that the grade levels are equally distributed across the school of 1,200 students. She would like to use a chi-square test to see if the proportion of individuals in each
class at the movie are also equally distributed. How many seniors would be expected at the event?
A
840
352.9
C
300
D
E
59.5
F10
FI1
F8
F9
吕口
F3
O00
000
F6
F7
esc
F4
F5
FI
F2
一
&
@
#
$
6
8
9
70
Expert Solution
This question has been solved!
Explore an expertly crafted, step-by-step solution for a thorough understanding of key concepts.

This is a popular solution!

Trending now
This is a popular solution!

Step by step
Solved in 2 steps

Knowledge Booster


Learn more about
Need a deep-dive on the concept behind this application? Look no further. Learn more about this topic, statistics and related others by exploring similar questions and additional content below.Recommended textbooks for you
Glencoe Algebra 1, Student Edition, 9780079039897…
Algebra
ISBN:
9780079039897
Author:
Carter
Publisher:
McGraw Hill

Holt Mcdougal Larson Pre-algebra: Student Edition…
Algebra
ISBN:
9780547587776
Author:
HOLT MCDOUGAL
Publisher:
HOLT MCDOUGAL

Algebra & Trigonometry with Analytic Geometry
Algebra
ISBN:
9781133382119
Author:
Swokowski
Publisher:
Cengage
Glencoe Algebra 1, Student Edition, 9780079039897…
Algebra
ISBN:
9780079039897
Author:
Carter
Publisher:
McGraw Hill
Holt Mcdougal Larson Pre-algebra: Student Edition…
Algebra
ISBN:
9780547587776
Author:
HOLT MCDOUGAL
Publisher:
HOLT MCDOUGAL
Algebra & Trigonometry with Analytic Geometry
Algebra
ISBN:
9781133382119
Author:
Swokowski
Publisher:
Cengage