The table gives the number of calories and the amount of cholesterol for selected fast food hamburgers. a. Graph the data in a scatter plot using the number of calories as the independent variable x and the amount of cholesterol as the dependent variable y. b. Use the data points (480, 60) and (720, 90) to write a linear function that defines the amount of cholesterol c(x) as a linear function of the number of calories x. c. Interpret the meaning of the slope in the context of this problem. d. Use the model from part (b) to predict the amount of cholesterol for a hamburger with 650 calories. Hamburger Calories Cholesterol (mg) 220 35 420 50 460 50 480 60 560 70 590 105 610 65 680 80 720 90
The table gives the number of calories and the amount of cholesterol for selected fast food hamburgers. a. Graph the data in a scatter plot using the number of calories as the independent variable x and the amount of cholesterol as the dependent variable y. b. Use the data points (480, 60) and (720, 90) to write a linear function that defines the amount of cholesterol c(x) as a linear function of the number of calories x. c. Interpret the meaning of the slope in the context of this problem. d. Use the model from part (b) to predict the amount of cholesterol for a hamburger with 650 calories. Hamburger Calories Cholesterol (mg) 220 35 420 50 460 50 480 60 560 70 590 105 610 65 680 80 720 90

Algebra for College Students
10th Edition
ISBN:9781285195780
Author:Jerome E. Kaufmann, Karen L. Schwitters
Publisher:Jerome E. Kaufmann, Karen L. Schwitters
Chapter8: Functions
Section8.CT: Test
Problem 19CT

Related questions
Question
100%
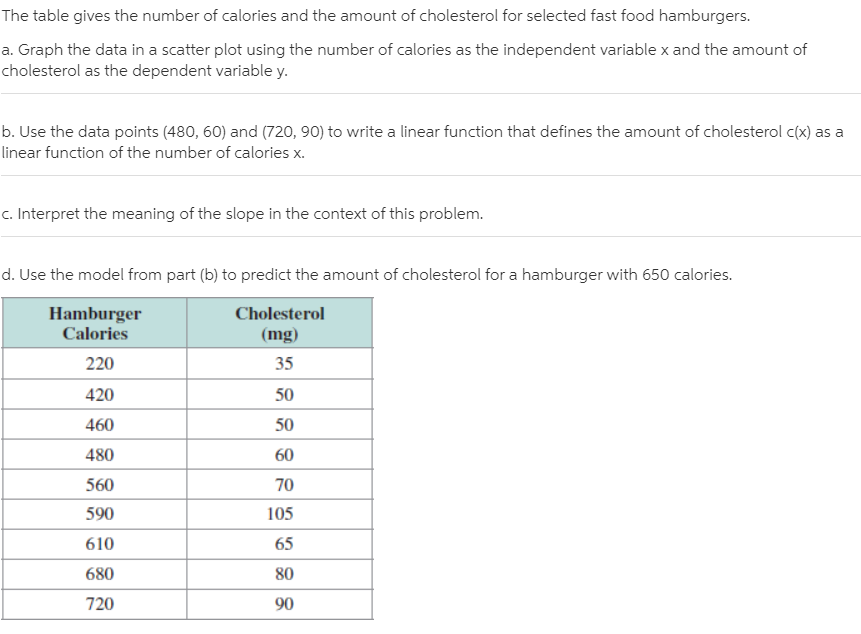
Transcribed Image Text:The table gives the number of calories and the amount of cholesterol for selected fast food hamburgers.
a. Graph the data in a scatter plot using the number of calories as the independent variable x and the amount of
cholesterol as the dependent variable y.
b. Use the data points (480, 60) and (720, 90) to write a linear function that defines the amount of cholesterol c(x) as a
linear function of the number of calories x.
c. Interpret the meaning of the slope in the context of this problem.
d. Use the model from part (b) to predict the amount of cholesterol for a hamburger with 650 calories.
Hamburger
Calories
Cholesterol
(mg)
220
35
420
50
460
50
480
60
560
70
590
105
610
65
680
80
720
90
Expert Solution
This question has been solved!
Explore an expertly crafted, step-by-step solution for a thorough understanding of key concepts.

This is a popular solution!

Trending now
This is a popular solution!

Step by step
Solved in 3 steps with 3 images

Recommended textbooks for you
Algebra for College Students
Algebra
ISBN:
9781285195780
Author:
Jerome E. Kaufmann, Karen L. Schwitters
Publisher:
Cengage Learning

Glencoe Algebra 1, Student Edition, 9780079039897…
Algebra
ISBN:
9780079039897
Author:
Carter
Publisher:
McGraw Hill

Algebra & Trigonometry with Analytic Geometry
Algebra
ISBN:
9781133382119
Author:
Swokowski
Publisher:
Cengage
Algebra for College Students
Algebra
ISBN:
9781285195780
Author:
Jerome E. Kaufmann, Karen L. Schwitters
Publisher:
Cengage Learning
Glencoe Algebra 1, Student Edition, 9780079039897…
Algebra
ISBN:
9780079039897
Author:
Carter
Publisher:
McGraw Hill
Algebra & Trigonometry with Analytic Geometry
Algebra
ISBN:
9781133382119
Author:
Swokowski
Publisher:
Cengage

Holt Mcdougal Larson Pre-algebra: Student Edition…
Algebra
ISBN:
9780547587776
Author:
HOLT MCDOUGAL
Publisher:
HOLT MCDOUGAL

Algebra and Trigonometry (MindTap Course List)
Algebra
ISBN:
9781305071742
Author:
James Stewart, Lothar Redlin, Saleem Watson
Publisher:
Cengage Learning

Algebra: Structure And Method, Book 1
Algebra
ISBN:
9780395977224
Author:
Richard G. Brown, Mary P. Dolciani, Robert H. Sorgenfrey, William L. Cole
Publisher:
McDougal Littell