The table gives the total emissions of lead into the atmosphere for selected years. Total Lead Emissions into the Atmosphere Lead, f (million tons) Year 1970 220.9 1975 159.7 1980 74.2 1985 22.9 1990 5.0 1995 3.9 (a) Find a logistic function that models the data. (Align the input data so that t 0 in 1970. Round all numerical values to three decimal places.) f(t) X (b) Estimate the location of the inflection point. (Round your answer to the nearest integer.) t =1978 X (c) Indicate where the curve is concave up and where it is concave down O The curve is concave down when t is less than the inflection point and is concave up when t is greater than the inflection point. The curve is concave up when t is less than the inflection point and is concave down when t is greater than the inflection point
The table gives the total emissions of lead into the atmosphere for selected years. Total Lead Emissions into the Atmosphere Lead, f (million tons) Year 1970 220.9 1975 159.7 1980 74.2 1985 22.9 1990 5.0 1995 3.9 (a) Find a logistic function that models the data. (Align the input data so that t 0 in 1970. Round all numerical values to three decimal places.) f(t) X (b) Estimate the location of the inflection point. (Round your answer to the nearest integer.) t =1978 X (c) Indicate where the curve is concave up and where it is concave down O The curve is concave down when t is less than the inflection point and is concave up when t is greater than the inflection point. The curve is concave up when t is less than the inflection point and is concave down when t is greater than the inflection point

Chapter6: Exponential And Logarithmic Functions
Section6.8: Fitting Exponential Models To Data
Problem 2TI: Sales of a video game released in the year 2000 took off at first, but then steadily slowed as time...

Related questions

Concept explainers
Contingency Table
A contingency table can be defined as the visual representation of the relationship between two or more categorical variables that can be evaluated and registered. It is a categorical version of the scatterplot, which is used to investigate the linear relationship between two variables. A contingency table is indeed a type of frequency distribution table that displays two variables at the same time.
Binomial Distribution
Binomial is an algebraic expression of the sum or the difference of two terms. Before knowing about binomial distribution, we must know about the binomial theorem.
Topic Video
Question
i am having trouble with this one.
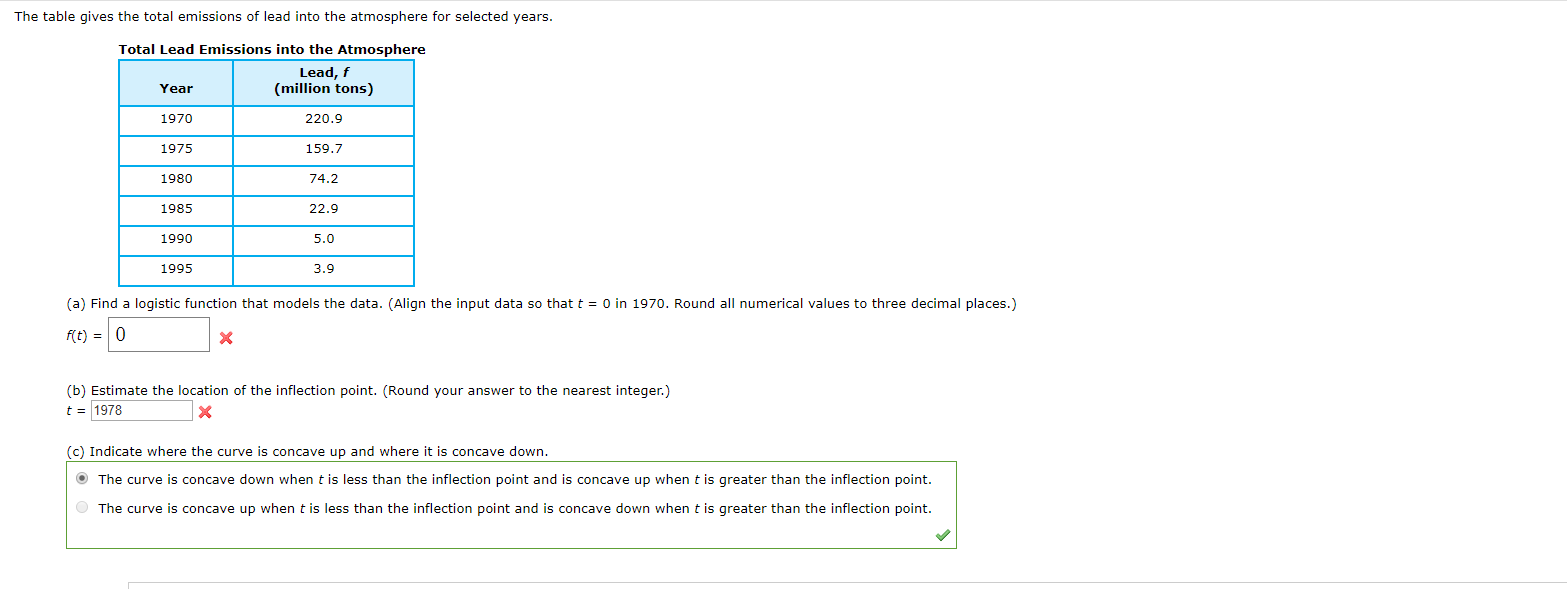
Transcribed Image Text:The table gives the total emissions of lead into the atmosphere for selected years.
Total Lead Emissions into the Atmosphere
Lead, f
(million tons)
Year
1970
220.9
1975
159.7
1980
74.2
1985
22.9
1990
5.0
1995
3.9
(a) Find a logistic function that models the data. (Align the input data so that t
0 in 1970. Round all numerical values to three decimal places.)
f(t)
X
(b) Estimate the location of the inflection point. (Round your answer to the nearest integer.)
t =1978
X
(c) Indicate where the curve is concave up and where it is concave down
O The curve is concave down when t is less than the inflection point and is concave up when t is greater than the inflection point.
The curve is concave up when t is less than the inflection point and is concave down when t is greater than the inflection point
Expert Solution
This question has been solved!
Explore an expertly crafted, step-by-step solution for a thorough understanding of key concepts.

This is a popular solution!

Trending now
This is a popular solution!

Step by step
Solved in 5 steps with 5 images

Knowledge Booster


Learn more about
Need a deep-dive on the concept behind this application? Look no further. Learn more about this topic, calculus and related others by exploring similar questions and additional content below.Recommended textbooks for you

College Algebra (MindTap Course List)
Algebra
ISBN:
9781305652231
Author:
R. David Gustafson, Jeff Hughes
Publisher:
Cengage Learning

Algebra & Trigonometry with Analytic Geometry
Algebra
ISBN:
9781133382119
Author:
Swokowski
Publisher:
Cengage
College Algebra (MindTap Course List)
Algebra
ISBN:
9781305652231
Author:
R. David Gustafson, Jeff Hughes
Publisher:
Cengage Learning
Algebra & Trigonometry with Analytic Geometry
Algebra
ISBN:
9781133382119
Author:
Swokowski
Publisher:
Cengage