The table lists the Consumer Price Index for all U.S. urban consumers (CPI-U) with 1982-1984 = 100 for selected years between 1960 and 2008 Consumer Price Index for All U.S. Urban Consumers 1982-1984 = 100 Year CPI-U, C 1960 29.6 1970 38.8 82.4 1980 130.7 1990 2000 172.2 2005 195.3 2008 215.3 (a) Align the input data to the number of years since 1960. Which model type other than quadratic might be considered when modeling this data? Why? OThe increasing, concave up scatter plot of this data suggests a quadratic or an logarithmic function. OThe increasing, concave up scatter plot of this data suggests a quadratic or an exponential function OThe increasing, concave down scatter plot of this data suggests a quadratic or an logarithmic function. OThe increasing, concave down scatter plot of this data suggests a quadratic or an exponential function (b) Use the end behavior to choose the better model. O quadratic logarithmic exponential 100 for 1982-1984) for all U.S. urban consumers, where t is the number of years since 1960, with data from 0 sts 48. (Round all numerical values to three decimal places.) Write the function for the better model that gives the CPI (based on a CPI 0.0385x1=2.1462r + 24.089X C(t)=
The table lists the Consumer Price Index for all U.S. urban consumers (CPI-U) with 1982-1984 = 100 for selected years between 1960 and 2008 Consumer Price Index for All U.S. Urban Consumers 1982-1984 = 100 Year CPI-U, C 1960 29.6 1970 38.8 82.4 1980 130.7 1990 2000 172.2 2005 195.3 2008 215.3 (a) Align the input data to the number of years since 1960. Which model type other than quadratic might be considered when modeling this data? Why? OThe increasing, concave up scatter plot of this data suggests a quadratic or an logarithmic function. OThe increasing, concave up scatter plot of this data suggests a quadratic or an exponential function OThe increasing, concave down scatter plot of this data suggests a quadratic or an logarithmic function. OThe increasing, concave down scatter plot of this data suggests a quadratic or an exponential function (b) Use the end behavior to choose the better model. O quadratic logarithmic exponential 100 for 1982-1984) for all U.S. urban consumers, where t is the number of years since 1960, with data from 0 sts 48. (Round all numerical values to three decimal places.) Write the function for the better model that gives the CPI (based on a CPI 0.0385x1=2.1462r + 24.089X C(t)=

Glencoe Algebra 1, Student Edition, 9780079039897, 0079039898, 2018
18th Edition
ISBN:9780079039897
Author:Carter
Publisher:Carter
Chapter10: Statistics
Section10.6: Summarizing Categorical Data
Problem 31PPS

Related questions

Concept explainers
Contingency Table
A contingency table can be defined as the visual representation of the relationship between two or more categorical variables that can be evaluated and registered. It is a categorical version of the scatterplot, which is used to investigate the linear relationship between two variables. A contingency table is indeed a type of frequency distribution table that displays two variables at the same time.
Binomial Distribution
Binomial is an algebraic expression of the sum or the difference of two terms. Before knowing about binomial distribution, we must know about the binomial theorem.
Topic Video
Question
i am having trouble with this one.
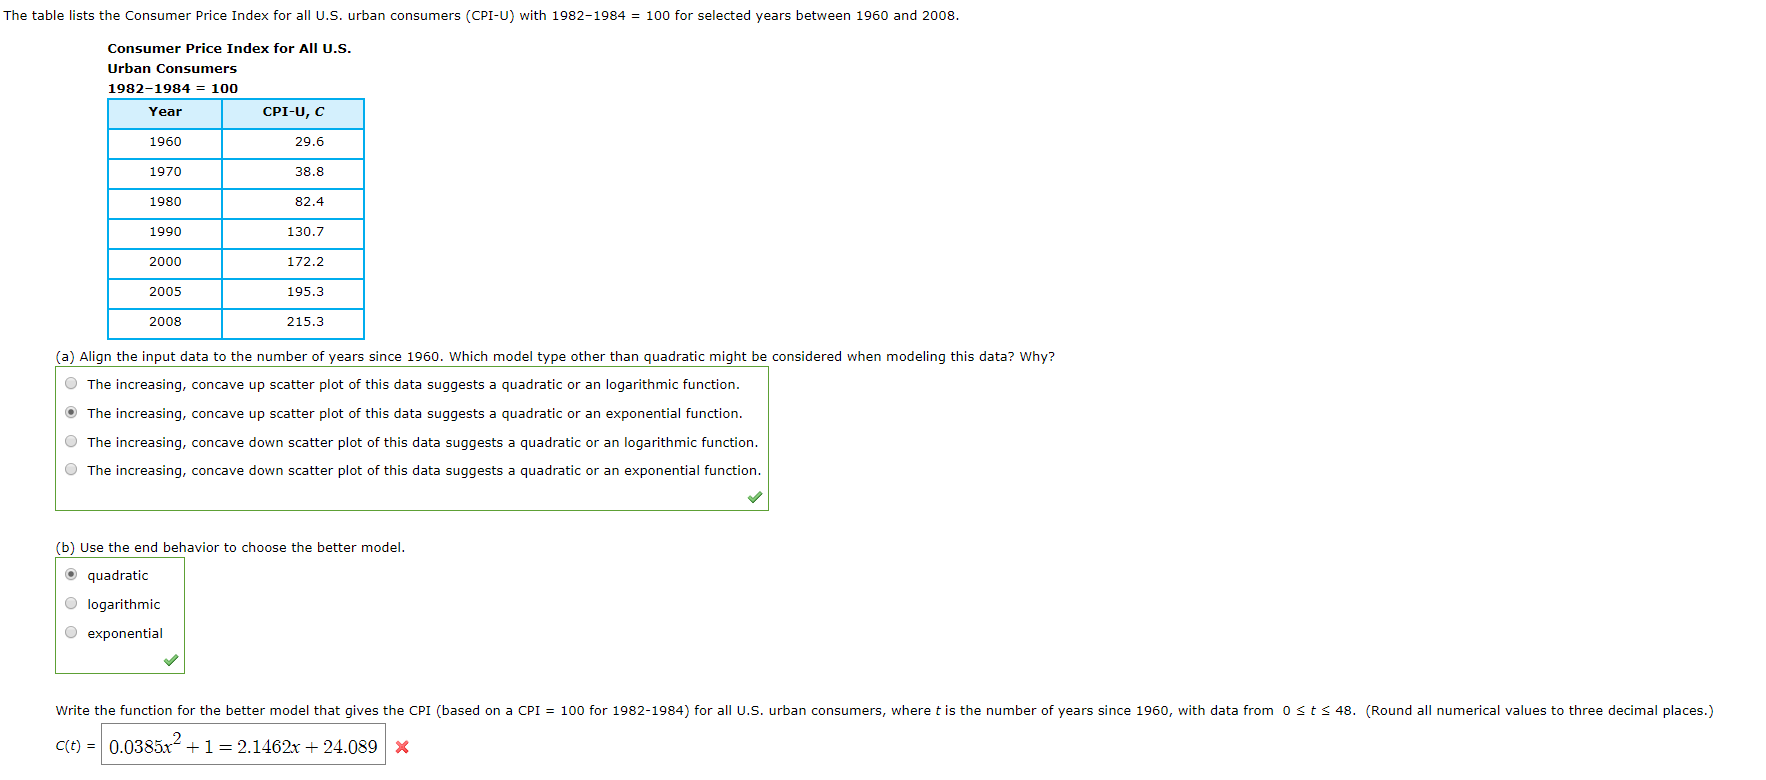
Transcribed Image Text:The table lists the Consumer Price Index for all U.S. urban consumers (CPI-U) with 1982-1984 = 100 for selected years between 1960 and 2008
Consumer Price Index for All U.S.
Urban Consumers
1982-1984 = 100
Year
CPI-U, C
1960
29.6
1970
38.8
82.4
1980
130.7
1990
2000
172.2
2005
195.3
2008
215.3
(a) Align the input data to the number of years since 1960. Which model type other than quadratic might be considered when modeling this data? Why?
OThe increasing, concave up scatter plot of this data suggests a quadratic or an logarithmic function.
OThe increasing, concave up scatter plot of this data suggests a quadratic or an exponential function
OThe increasing, concave down scatter plot of this data suggests a quadratic or an logarithmic function.
OThe increasing, concave down scatter plot of this data suggests a quadratic or an exponential function
(b) Use the end behavior to choose the better model.
O quadratic
logarithmic
exponential
100 for 1982-1984) for all U.S. urban consumers, where t is the number of years since 1960, with data from 0 sts 48. (Round all numerical values to three decimal places.)
Write the function for the better model that gives the CPI (based on a CPI
0.0385x1=2.1462r + 24.089X
C(t)=
Expert Solution
This question has been solved!
Explore an expertly crafted, step-by-step solution for a thorough understanding of key concepts.

This is a popular solution!

Trending now
This is a popular solution!

Step by step
Solved in 5 steps with 5 images

Knowledge Booster


Learn more about
Need a deep-dive on the concept behind this application? Look no further. Learn more about this topic, calculus and related others by exploring similar questions and additional content below.Recommended textbooks for you
Glencoe Algebra 1, Student Edition, 9780079039897…
Algebra
ISBN:
9780079039897
Author:
Carter
Publisher:
McGraw Hill
Glencoe Algebra 1, Student Edition, 9780079039897…
Algebra
ISBN:
9780079039897
Author:
Carter
Publisher:
McGraw Hill