The table lists the Consumer Price Index for all U.S. urban consumers (CPI-U) with 1982-1984 = 100 for selected years between 1960 and 2008 Consumer Price Index for All U.S. Urban Consumers 1982-1984 100 CPI-U, C Year 1960 29.6 1970 38.8 1980 82.4 1990 130.7 2000 172.2 2005 195.3 2008 215.3 (a) Align the input data to the number of years since 1960. Which model type other than quadratic might be considered when modeling this data? Why? OThe increasing, concave up scatter plot of this data suggests a quadratic or an logarithmic function OThe increasing, concave up scatter plot of this data suggests a quadratic or an exponential function OThe increasing, concave down scatter plot of this data suggests a quadratic or an logarithmic function The increasing, concave down scatter plot of this data suggests a quadratic or an exponential function (b) Use the end behavior to choose the better model O quadratic Ologarithmic exponential 100 for 1982-1984) for all U.S. urban consumers, where t is the number of years since 1960, with data from 0 sts 48. (Round all numerical values to three decimal places.) Write the function for the better model that gives the CPI (based on a CPI C(t)
The table lists the Consumer Price Index for all U.S. urban consumers (CPI-U) with 1982-1984 = 100 for selected years between 1960 and 2008 Consumer Price Index for All U.S. Urban Consumers 1982-1984 100 CPI-U, C Year 1960 29.6 1970 38.8 1980 82.4 1990 130.7 2000 172.2 2005 195.3 2008 215.3 (a) Align the input data to the number of years since 1960. Which model type other than quadratic might be considered when modeling this data? Why? OThe increasing, concave up scatter plot of this data suggests a quadratic or an logarithmic function OThe increasing, concave up scatter plot of this data suggests a quadratic or an exponential function OThe increasing, concave down scatter plot of this data suggests a quadratic or an logarithmic function The increasing, concave down scatter plot of this data suggests a quadratic or an exponential function (b) Use the end behavior to choose the better model O quadratic Ologarithmic exponential 100 for 1982-1984) for all U.S. urban consumers, where t is the number of years since 1960, with data from 0 sts 48. (Round all numerical values to three decimal places.) Write the function for the better model that gives the CPI (based on a CPI C(t)

Linear Algebra: A Modern Introduction
4th Edition
ISBN:9781285463247
Author:David Poole
Publisher:David Poole
Chapter4: Eigenvalues And Eigenvectors
Section4.6: Applications And The Perron-frobenius Theorem
Problem 25EQ

Related questions
Question
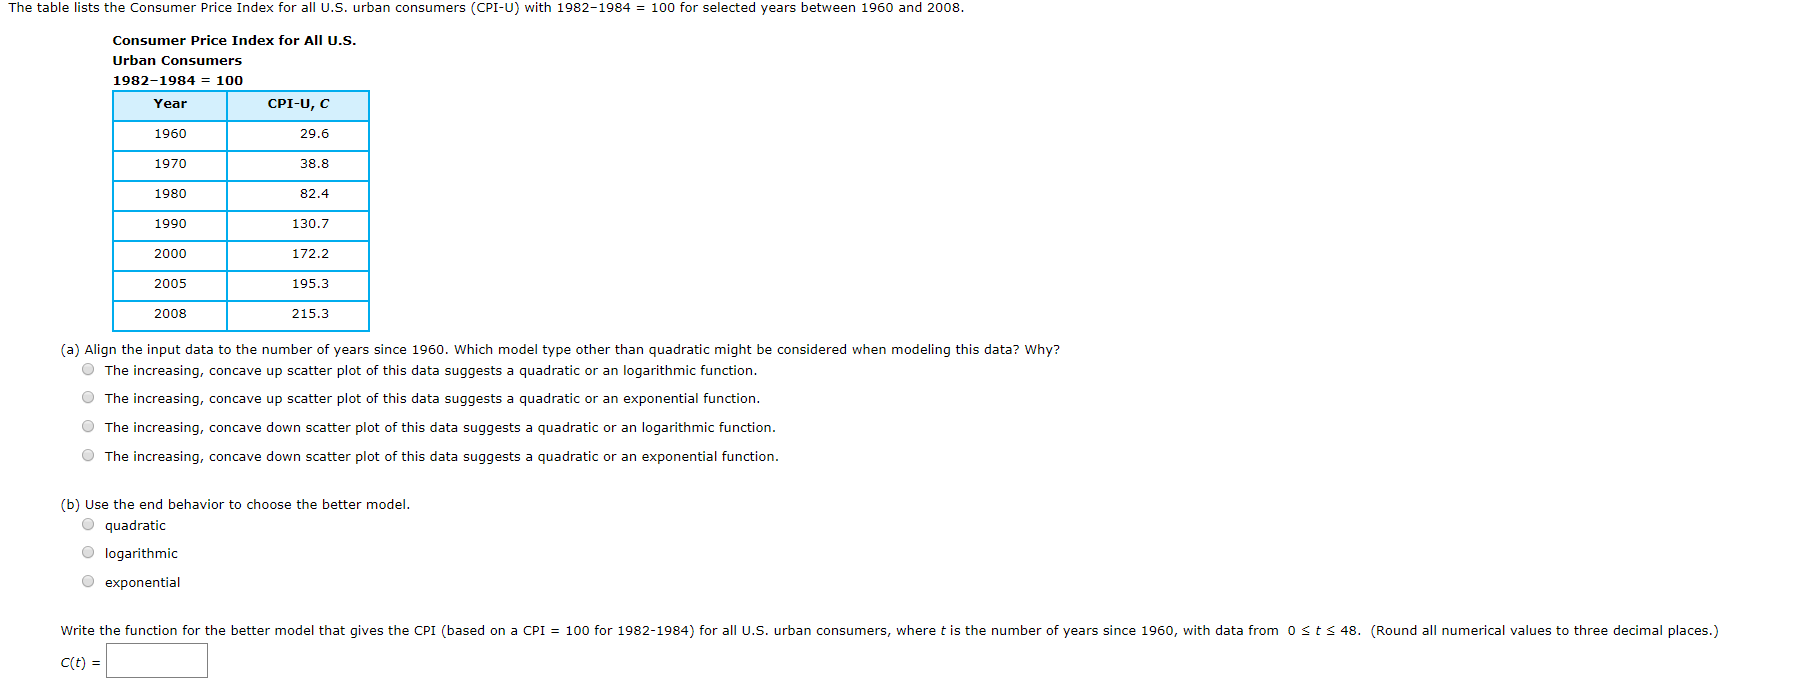
Transcribed Image Text:The table lists the Consumer Price Index for all U.S. urban consumers (CPI-U) with 1982-1984 = 100 for selected years between 1960 and 2008
Consumer Price Index for All U.S.
Urban Consumers
1982-1984 100
CPI-U, C
Year
1960
29.6
1970
38.8
1980
82.4
1990
130.7
2000
172.2
2005
195.3
2008
215.3
(a) Align the input data to the number of years since 1960. Which model type other than quadratic might be considered when modeling this data? Why?
OThe increasing, concave up scatter plot of this data suggests a quadratic or an logarithmic function
OThe increasing, concave up scatter plot of this data suggests a quadratic or an exponential function
OThe increasing, concave down scatter plot of this data suggests a quadratic or an logarithmic function
The increasing, concave down scatter plot of this data suggests a quadratic or an exponential function
(b) Use the end behavior to choose the better model
O quadratic
Ologarithmic
exponential
100 for 1982-1984) for all U.S. urban consumers, where t is the number of years since 1960, with data from 0 sts 48. (Round all numerical values to three decimal places.)
Write the function for the better model that gives the CPI (based on a CPI
C(t)
Expert Solution
This question has been solved!
Explore an expertly crafted, step-by-step solution for a thorough understanding of key concepts.

This is a popular solution!

Trending now
This is a popular solution!

Step by step
Solved in 3 steps with 2 images

Recommended textbooks for you
Linear Algebra: A Modern Introduction
Algebra
ISBN:
9781285463247
Author:
David Poole
Publisher:
Cengage Learning

Glencoe Algebra 1, Student Edition, 9780079039897…
Algebra
ISBN:
9780079039897
Author:
Carter
Publisher:
McGraw Hill
Linear Algebra: A Modern Introduction
Algebra
ISBN:
9781285463247
Author:
David Poole
Publisher:
Cengage Learning
Glencoe Algebra 1, Student Edition, 9780079039897…
Algebra
ISBN:
9780079039897
Author:
Carter
Publisher:
McGraw Hill