The table shows experimental valucs of two variables x and y. 0.1 0.5 1 1.5 2 y -5.95 1.63 0.83 0.61 0.5 It is known that x and y are related by the equation = ax+ where a and b are y a constants, (1) Plot - against vx to obtain a straight line graph. (ii) Use your graph to estimate the values of a and b. (ii) If, instead, a straight line is obtained by plotting- against - find the gradient y/x of the line.
The table shows experimental valucs of two variables x and y. 0.1 0.5 1 1.5 2 y -5.95 1.63 0.83 0.61 0.5 It is known that x and y are related by the equation = ax+ where a and b are y a constants, (1) Plot - against vx to obtain a straight line graph. (ii) Use your graph to estimate the values of a and b. (ii) If, instead, a straight line is obtained by plotting- against - find the gradient y/x of the line.

Algebra & Trigonometry with Analytic Geometry
13th Edition
ISBN:9781133382119
Author:Swokowski
Publisher:Swokowski
Chapter7: Analytic Trigonometry
Section7.6: The Inverse Trigonometric Functions
Problem 91E

Related questions
Question
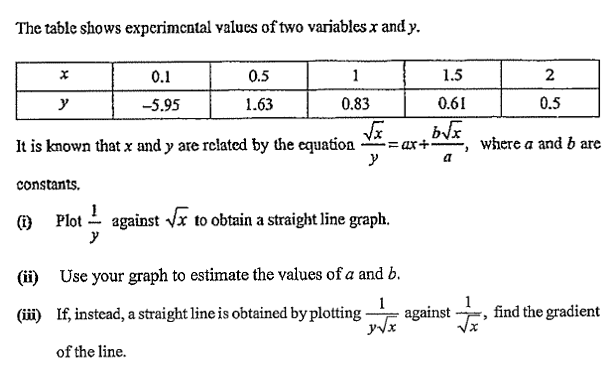
Transcribed Image Text:The table shows experimental values of two variables x and y.
0.1
0.5
1
1.5
y
-5.95
1.63
0.83
0.61
0.5
It is known that x and y are rclated by the equation
where a and b are
-= ax+
a
constants,
Plot - against vx to obtain a straight line graph.
y
(i)
(i) Use your graph to estimate the values of a and b.
(iüi) If, instead, a straight line is obtained by plotting -
1
against
yvx
find the gradient
of the line.
Expert Solution
This question has been solved!
Explore an expertly crafted, step-by-step solution for a thorough understanding of key concepts.

This is a popular solution!

Trending now
This is a popular solution!

Step by step
Solved in 4 steps with 4 images

Recommended textbooks for you
Algebra & Trigonometry with Analytic Geometry
Algebra
ISBN:
9781133382119
Author:
Swokowski
Publisher:
Cengage
Algebra & Trigonometry with Analytic Geometry
Algebra
ISBN:
9781133382119
Author:
Swokowski
Publisher:
Cengage