The Tiliche Corp. analyst conducted 10 independent timing studies in the manual spray painting section of the finishing department. The product line under study revealed a direct relationship between spray painting time and product surface area. The following data were collected (ignore the rating factor): (image) To answer: (a) Find the linear model relating standard time (y) to surface area (x) using linear regression. b) How much time would you assign to spray painting a new part with a surface area of 250 in2? c) Obtain the fitted value of y and the corresponding residual for a particular assembly (study #3) with a surface area of 150 square inches. d) Perform a significance test of the regression using α= 0.05. Find the P-value for this test. What are your conclusions? e) Estimate the standard errors of the slope and the value of the intercept. f) Calculate the coefficient of determination R2 . g) Calculate the correlation coefficient r. Note: The exercise in the image is the original, it is in Spanish, but it is easy to understand. Note: ONLY ANSWER exercises d) e) f) g)


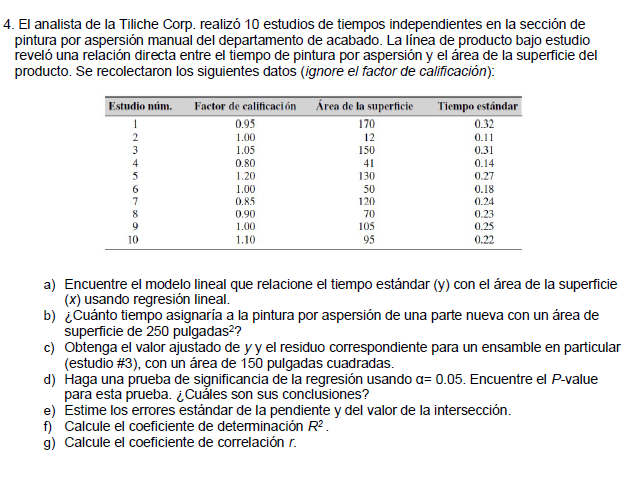
The Tiliche Corp. analyst conducted 10 independent timing studies in the manual spray painting section of the finishing department. The product line under study revealed a direct relationship between spray painting time and product surface area. The following data were collected (ignore the rating factor):
(image)
To answer:
(a) Find the linear model relating standard time (y) to surface area (x) using linear regression.
b) How much time would you assign to spray painting a new part with a surface area of 250 in2?
c) Obtain the fitted value of y and the corresponding residual for a particular assembly (study #3) with a surface area of 150 square inches.
d) Perform a significance test of the regression using α= 0.05. Find the P-value for this test. What are your conclusions?
e) Estimate the standard errors of the slope and the value of the intercept.
f) Calculate the coefficient of determination R2 .
g) Calculate the
Note:
The exercise in the image is the original, it is in Spanish, but it is easy to understand.
Note:
ONLY ANSWER exercises d) e) f) g)

Step by step
Solved in 2 steps with 2 images


