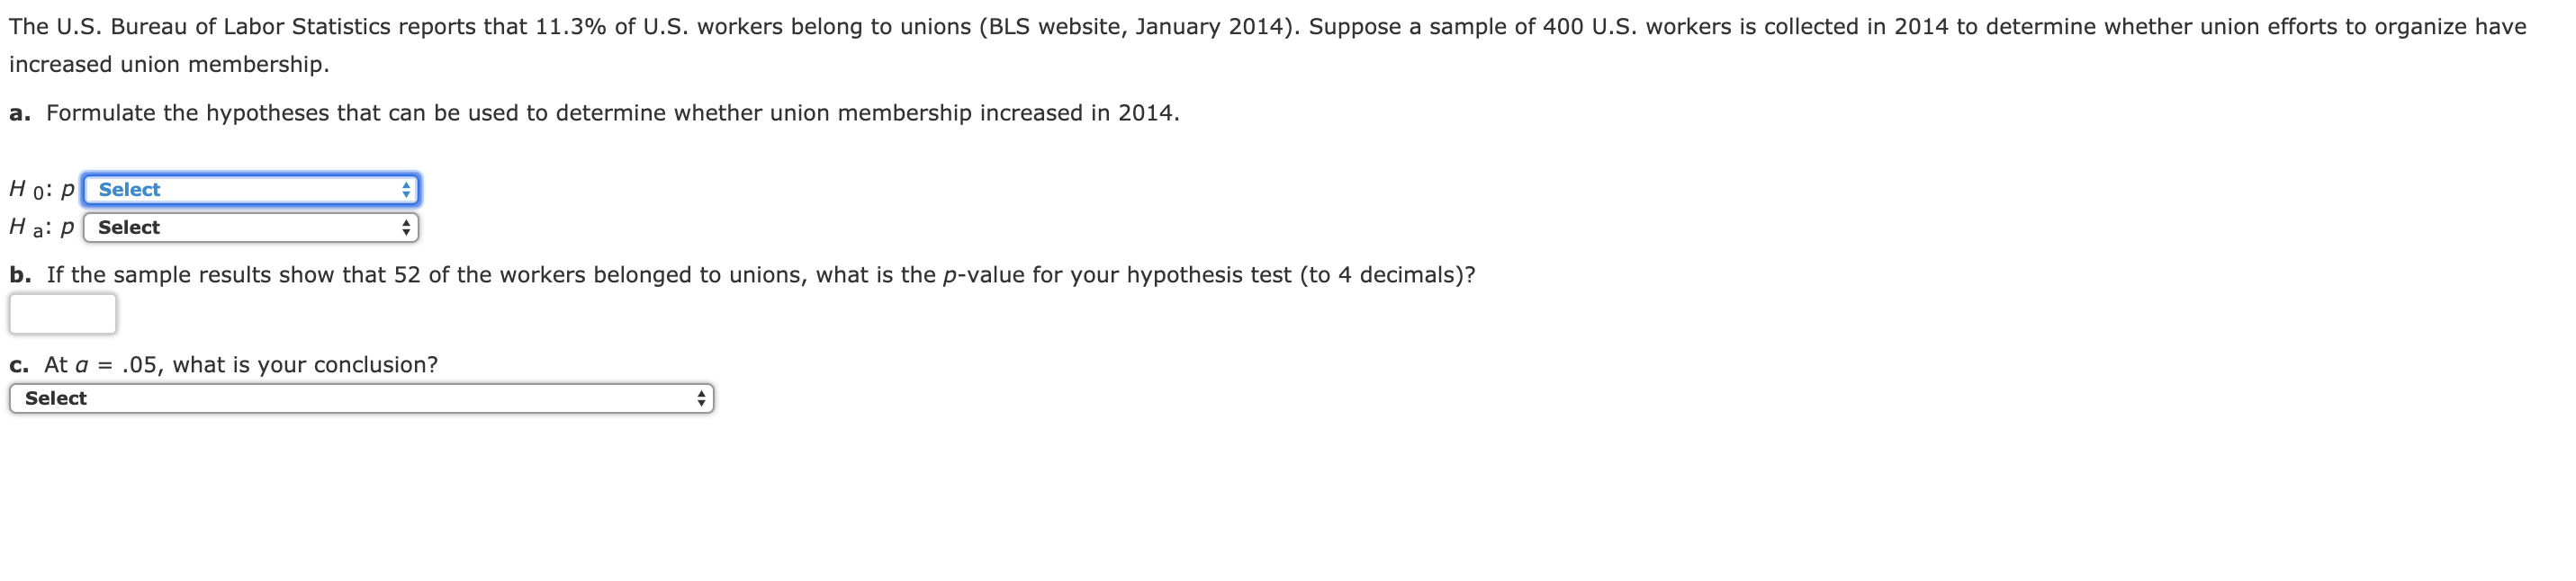
The U.S. Bureau of Labor Statistics reports that 11.3% of U.S. workers belong to unions (BLS website, January 2014). Suppose a sample of 400 U.S. workers is collected in 2014 to determine whether union efforts to organize have increased union membership. a. Formulate the hypotheses that can be used to determine whether union membership increased in 2014. Ho: p Select Select b. If the sample results show that 52 of the workers belonged to unions, what is the p-value for your hypothesis test (to 4 decimals)? c. Ata- 05, what is your conclusion? Select


Q: An employee claims that 20% of the email she receives is personal, 60% is work related, and 20% is…
A: Given data An employee claims that 20% of the email she receives is personal 60% is work related and…
Q: In the 2012 presidential pre-election surveys, Pew Research sampled 1,112 likely voters during…
A: Sample size: Large sample sizes gives accurate results. Large sample sizes gives greater…
Q: At a certain college, it is estimated that at most 35% of the students ride bicycles to class. At…
A: given let p = 0.35 represent the proportion of students who ride bicycles to class let x = 28…
Q: According to a recent report, 44% of college student internships are unpaid. A recent survey of 60…
A:
Q: An agency reports that 11.5% of workers in a particular country belonged to unions. Suppose a sample…
A: (b) The sample proportion is, p^=xn=42300=0.14 The test statistic is,…
Q: India 18% 82% (a) Suppose the sample sizes were 1,000 for the United States and for India and 500…
A:
Q: Which of the following is the correct standardized test statistic and P-value for the hypotheses, ?
A:
Q: In which of the following studies are researchers most likely to possibly use cross-sectional…
A: Cross-sectional Surveys: In research studies when our research design is built up in such a way that…
Q: According to a recent report, 46% of college student internships are unpaid. A recent survey of 80…
A: Since you have asked two questions, I am submitting the part a. Please re post the part b as next…
Q: A report provided the following information on gender of smartphone users for representative samples…
A: The given percentages for the male and female smartphone users for different countries are:…
Q: According to the IRS, individuals filing federal income tax returns prior to March 31 received an…
A: The significance of the mean is calculated if the population standard deviation is unknown and the…
Q: A. If the null hypothesis is true, how many flowers in the experiment would be expected to be…
A:
Q: According to the Centers for Disease Control and Prevention, 9.7% of high school students currently…
A:
Q: As a result of complaints from customers about delivery times, the manager at a pizza delivery…
A: Given that Until now , The manager has believed the delivery time was 25 minutes. We know that…
Q: In 2010, the Maricopa Community College District's enrollment data showed the following breakdown of…
A:
Q: In a recent survey, it was stated that Americans watch television on average four hours per day.…
A: It is provided that the sample mean is 40. As the average time of watching television can never be…
Q: Over the past few decades, public health officials have examined the link between weight concerns…
A: From the provided information, Sample size (n) = 273 From which 63 said they smoked to stay thin.
Q: 1. School wants to know if academic performance is dependent on living arrangements of the students?…
A: It is needed to test whether the academic performance is dependent on living arrangements of the…
Q: Based on a USA Today poll, 10% of the population believes that college is no longer a good…
A:
Q: In a recent study of a random sample of 113 people, 92 reported dreaming in color. In the 1940’s,…
A: The random variable dreaming in color follows binomial distribution. The sample size is 113. The…
Q: In June of 1997, Australians were asked if they thought unemployment would increase, and 52%…
A: Given Information : In June of 1997, Australians were asked if they thought unemployment would…
Q: The National Technology Readiness Survey sponsored by the Smith School of Business at the University…
A: Denote p2009 and p2004 as the true population proportions of spam emails deleted by Americans in…
Q: A Gallup poll taken in May 2000 asked the question, “Which of the following do you think is the…
A: Given, Men: n1 = 493, p1 = 0.51 Women: n2 = 538, p2 = 0.38
Q: Estate Association claims that the median rental for three-bedroom condominiums is more than $1,200…
A: The null hypothesis always contains less than Or equal(≤), greater than Or equal (≥)and equal to(=)…
Q: In 1948, an organization surveyed 1100 adults and asked, "Are you a total abstainer from, or do…
A: State the hypotheses. Obtain the value of the test statistic. The value of test statistic is…
Q: A large pizza chain has conducted a study to determine if the types of preferred pizza are…
A: Given : A large pizza chain has conducted a study to determine if the types of preferred pizza are…
Q: A local school board believes there is a difference in the proportion of households with school-aged…
A: The test is to check whether there is a difference in the proportion of households with school-aged…
Q: According to a recent report, 46% of college student internships are unpaid. A recent survey of 80…
A: State the hypotheses.
Q: A local school board believes there is a difference in the proportion of households with school-aged…
A: Solution-: Let ps- the true proportion of households with school-aged children that would support…
Q: A bank would like to study the waiting time of serving customers during the noon-to- 1 p.m. lunch…
A: Given data : Residential area : 4.21,5.55,3.02,5.13,4.77,9.66,5.90,8.02,5.79,8.73 Commercial…
Q: A bank would like to study the waiting time of serving customers during the noon-to- 1 p.m. lunch…
A: Since, it is not mentioned which question to be answered, we'll be answering the first one. Please…
Q: A survey was administered to a sample of American college students. Data was gathered regarding…
A: Data values that are a simple random sample from the full population. Categorical or nominal data.…
Q: 4. A researcher interviews by phone a province-wide random sample of persons aged 18 and above about…
A: Given,
Q: If a simple random sample of size 34 was collected, the following hypotheses tests will have the…
A: Correct answer is H0: μ=42 and H1: μ≠42
Q: The National Institute of Mental Health published an article stating that in any one-year period,…
A: Since you have posted a question with multiple sub-parts, we will solve first three subparts for…
Q: 2.The Gallup organization periodically polls adults living in the U.S. about the issue of…
A:
Q: A Los Angeles research group publishes an an- Lual report on trends in real estate. Suppose 200…
A: Given: Sample size (n) = 200 Sample proportion p^=0.78 Confidence interval = 0.90
Q: According to a recent report, 46% of college student internships are unpaid. A recent survey of 60…
A: The question is about hypo. testing for popl. prop. Given : Prop. of college students whose…
Q: Suppose we wanted to compare the average BMI of a sample of Charleston County residents to the…
A: Here, population mean is 26.5. From the above data we will find mean and standard deviation. We will…
Q: The Ministry of Labor has commissioned a study with manufacturing and mining establishments in…
A: Given information: p=0.25, p^=0.30278831, n=320
Q: The U.S. Department of Transportation, National Highway Traffic Safety Administration, reported that…
A:
Q: Suppose that a report indicates that 28% of Canadian homeowners have experienced difficulty in…
A:
Q: A decade-old study found that the proportion of high school seniors who felt that "getting rich" was…
A: It is a two-tailed test.
Q: A report provided the following information on gender of smartphone users for representative samples…
A: a. Given : The sample sizes were 1000 for the United States and for India and 500 for Spain and…
Q: In a survey of 1,000 women age 22 to 35 who work full-time, 555 indicated that they would be willing…
A: Given : Sample size = n = 1000 Sample number of events = D = 555 Sample proportion = p^ = Dn = 0.555…
Q: The National Institute of Mental Health published an article stating that in any one-year period,…
A:
Q: According to Nielsen Media Research, of all the U. S. Households that owned at least one television…
A: From the provided information, The hypotheses can be constructed as: H0: p = 0.83 Ha: p < 0.83…


Trending now
This is a popular solution!

Step by step
Solved in 3 steps with 2 images

- The National Institute of Mental Health published an article stating that in any two-year period, approximately 10.5percent of American adults suffer from depression or a depressive illness. Suppose that in a survey of 150 people in a certain town, eight of them suffered from depression or a depressive illness. If you were conducting a hypothesis test to determine if the true proportion of people in that town suffering from depression or a depressive illness is lower than the percent in the general adult American population, what would the null and alternative hypotheses be?A low-level CDC bureaucrat wants to please his boss by gathering evidence thatthe current government-mandated shutdown of society is not causing people’s mentalhealth to deteriorate, so that it can safely be continued for several years if anyexpert says it’s necessary.He polls a random sample of 1600 citizens, gathering data on such items asincome loss, weight gain, access to toilet paper, hours spent binge-watchingNetflix, and number of injuries caused by household fights, and compiles all thisinto a scientifically-weighted “misery index”.The mean misery index from the sample is 99.2; it seems reasonable to use apopulation standard deviation σ = 19.1.a) Does this information provide significant evidence (at the 5% level) that thenationwide mean misery index is less than 100? Set up appropriate null andalternative hypotheses, calculate the appropriate test statistic, find the P-value,and state your conclusion. (10)b) A CDC press release publishing the results of this study claims that…A low-level CDC bureaucrat wants to please his boss by gathering evidence thatthe current government-mandated shutdown of society is not causing people’s mentalhealth to deteriorate, so that it can safely be continued for several years if anyexpert says it’s necessary.He polls a random sample of 1600 citizens, gathering data on such items asincome loss, weight gain, access to toilet paper, hours spent binge-watchingNetflix, and number of injuries caused by household fights, and compiles all thisinto a scientifically-weighted “misery index”.The mean misery index from the sample is 99.2; it seems reasonable to use apopulation standard deviation σ = 19.1.a) Does this information provide significant evidence (at the 5% level) that thenationwide mean misery index is less than 100? Set up appropriate null andalternative hypotheses, calculate the appropriate test statistic, find the P-value,and state your conclusion. b) A CDC press release publishing the results of this study claims that…
- In analyzing the consumption of cottage cheese by members of various occupational groups, the United Dairy Industry Association found that 326 of 837 professionals seldom or never ate cottage cheese, versus 220 of 489 white-collar workers and 522 of 1243 blue-collar workers (Sheet 53). Assuming independent samples, use the 0.03 level in testing the null hypothesis that the population proportions could be the same for the three occupational groups. Sheet 53 Group 1 Group 2 Group 3 Total seldom or never 326 220 522 1068 often 511 269 721 1501 Total 837 489 1243 2569 Select one: a) chi-square stat = 4.81, crit. value = 7.01, fail to reject H0, population proportions are not different b) p-value = 0.09, reject H0, population proportions are not different c) chi-square stat = 4.81, crit. value = 9.2, fail to reject H0, population proportions are not different d) p-value = 0.029, reject H0, population proportions differentA study, which randomly surveyed 3,700 households and drew on this information from the IRS, found that 79% of households have conducted at least one IRA rollover from an employer-sponsored retirement plan. Suppose a recent random sample of 90 households in a certain county was taken and respondents were asked whether they had ever funded an IRA account with a rollover from an employer-sponsored retirement plan. Based on the sample data below, can you conclude at the 0.10 level of significance that the proportion of households in the county that have funded an IRA with a rollover is different from the proportion for all households reported in the study? 77 respondents said they had funded an account; 13 respondents said they had notUtilizing the previous table: A sample of 25 cities have been classified as high or low on their homicide rates and on the number of handguns sold within the city limits. Was the null hypothesis rejected or accepted?
- The National Institute of Mental Health published an article stating that in any one-year period, approximately 9.5 percent of American adults suffer from depression or a depressive illness. Suppose that in a survey of 100 people in a certain town, seven of them suffered from depression or a depressive illness. Conduct a hypothesis test to determine if the true proportion of people in that town suffering from depression or a depressive illness is lower than the percent in the general adult American population. find the p value31% of all pygmy softshell toises have stripes on their shells. A herpetologist in Cititon collects a sample of 28 pygmy softshell tortoises and finds that 8 of them have stripes on their shells. Is there enough evidence to conclude, at a significance of alpha=0.05, that the proportion of pygmy softshell tortoises in Cititon with stripes on their shells is less than 31%? What is the claim? What is the null hypothesis? What is the alternative hypothesis? What is the test statistic? What is/are the critical value(s)? Do we reject the null hypothesis? What conclusion do we draw? What is the P-value for the problem above?4. The National Institute of Mental Health published an article stating that in any one-year period, approximately 9.5 percent of American adults suffer from depression or a depressive illness. Suppose that in a survey of 100 people in a certain town, seven of them suffered from depression or a depressive illness. Conduct a hypothesis test to determine if the true proportion of people in that town suffering from depression or a depressive illness is lower than the percent in the general adult American population.
- A random sample of 50 suspension helmets used by motorcycle riders and automobile race-car drivers was subjected to an impact test, and on 18 of these helmets some damage was observed.The Stanford University Heart Transplant Study was conducted to determine whether an experimental heart transplant program increased lifespan. Each patient entering the program was officially designated a heart transplant candidate, meaning that he was gravely ill and might benefit from a new heart. Patients were randomly assigned into treatment and control groups. Patients in the treatment group received a transplant, and those in the control group did not. The table below displays how many patients survived and died in each group ___ control______treatment___ alive 4 | 24 dead 30 | 45 A hypothesis test would reject the conclusion that the survival rate is the same in each group, and so we might like to calculate a confidence interval. Explain why we cannot construct such an interval using the normal approximation. What might go wrong if we constructed the confidence interval despite this problem?31% of all pygmy softshell tortoises have stripes on their shells. A herpetologist in Cititon collects a sample of 28 pygmy softshell tortoises and finds that 8 of them have stripes on their shells. Is there enough evidence to conclude, at a significance of alpha = 0.05, that the proportion of pygmy softshell tortoises in Cititon with stripes on their shells is less than 31%? What is the claim? What is the null hypothesis? What is the alternative hypothesis? What is the test statistic? What is/are the critical value(s)? Do we reject the null hypothesis? What conclusion do we draw? What is the P-value for the problem above?