The value of the geometric mean for the frequency distribution shown in * :the table below lies between Class Frequency Midpoint 61 64 18 67 42 70 27 73 56-58 O 66-68 O 72-74 O 60-62 O 63-65 O 69-71 O 53-55 O
The value of the geometric mean for the frequency distribution shown in * :the table below lies between Class Frequency Midpoint 61 64 18 67 42 70 27 73 56-58 O 66-68 O 72-74 O 60-62 O 63-65 O 69-71 O 53-55 O

Mathematics For Machine Technology
8th Edition
ISBN:9781337798310
Author:Peterson, John.
Publisher:Peterson, John.
Chapter29: Tolerance, Clearance, And Interference
Section: Chapter Questions
Problem 16A: Spacers are manufactured to the mean dimension and tolerance shown in Figure 29-12. An inspector...

Related questions
Question
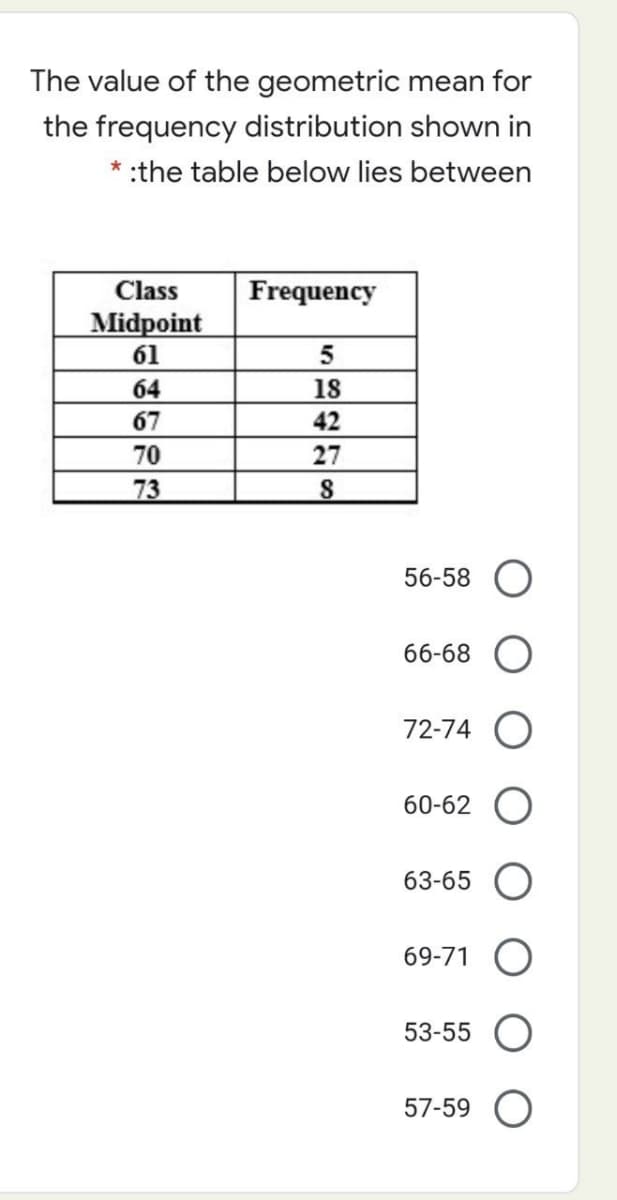
Transcribed Image Text:The value of the geometric mean for
the frequency distribution shown in
* :the table below lies between
Class
Frequency
Midpoint
61
64
18
67
42
70
27
73
56-58 O
66-68 O
72-74 O
60-62
63-65
69-71 O
53-55
57-59 O
Expert Solution
This question has been solved!
Explore an expertly crafted, step-by-step solution for a thorough understanding of key concepts.

This is a popular solution!

Trending now
This is a popular solution!

Step by step
Solved in 2 steps with 2 images

Recommended textbooks for you
Mathematics For Machine Technology
Advanced Math
ISBN:
9781337798310
Author:
Peterson, John.
Publisher:
Cengage Learning,
Mathematics For Machine Technology
Advanced Math
ISBN:
9781337798310
Author:
Peterson, John.
Publisher:
Cengage Learning,