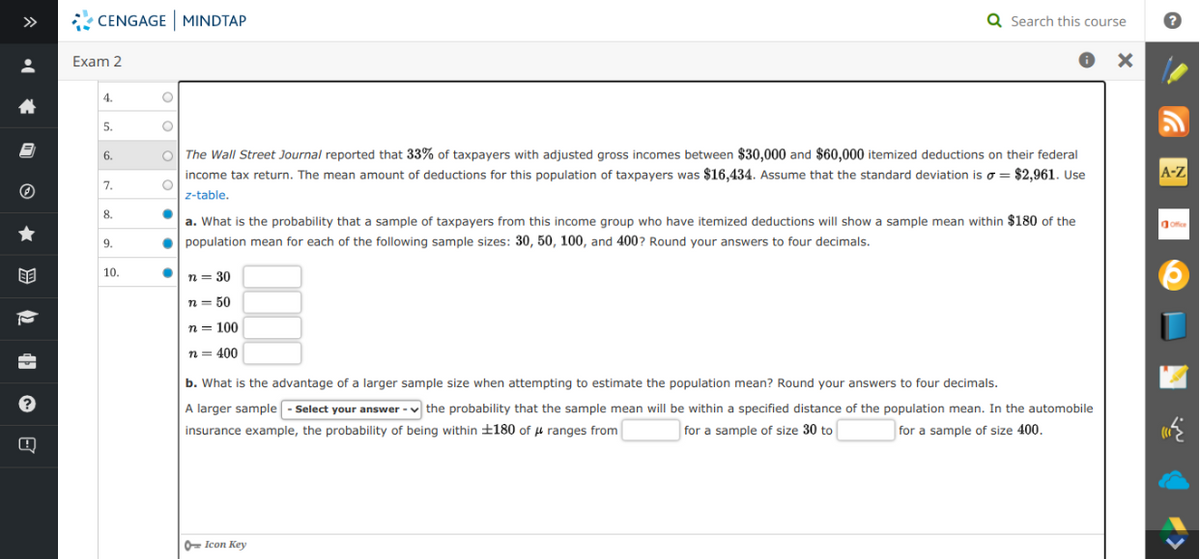
The Wall Street Journal reported that 33% of taxpayers with adjusted gross incomes between $30,000 and $60,000 itemized deductions on their federal income tax return. The mean amount of deductions for this population of taxpayers was $16,434. Assume that the standard deviation is o = $2,961. Use z-table. a. What is the probability that a sample of taxpayers from this income group who have itemized deductions will show a sample mean within $180 of the population mean for each of the following sample sizes: 30, 50, 100, and 400? Round your answers to four decimals. n = 30 n= 50 n = 100 n= 400 b. What is the advantage of a larger sample size when attempting to estimate the population mean? Round your answers to four decimals. A larger sample - sSelect your answer - v the probability that the sample mean will be within a specified distance of the population mean. In the automobile insurance example, the probability of being within ±180 of µ ranges from for a sample of size 30 to| for a sample of size 400.
The Wall Street Journal reported that 33% of taxpayers with adjusted gross incomes between $30,000 and $60,000 itemized deductions on their federal income tax return. The mean amount of deductions for this population of taxpayers was $16,434. Assume that the standard deviation is o = $2,961. Use z-table. a. What is the probability that a sample of taxpayers from this income group who have itemized deductions will show a sample mean within $180 of the population mean for each of the following sample sizes: 30, 50, 100, and 400? Round your answers to four decimals. n = 30 n= 50 n = 100 n= 400 b. What is the advantage of a larger sample size when attempting to estimate the population mean? Round your answers to four decimals. A larger sample - sSelect your answer - v the probability that the sample mean will be within a specified distance of the population mean. In the automobile insurance example, the probability of being within ±180 of µ ranges from for a sample of size 30 to| for a sample of size 400.

Glencoe Algebra 1, Student Edition, 9780079039897, 0079039898, 2018
18th Edition
ISBN:9780079039897
Author:Carter
Publisher:Carter
Chapter10: Statistics
Section10.3: Measures Of Spread
Problem 26PFA

Related questions

Concept explainers
Contingency Table
A contingency table can be defined as the visual representation of the relationship between two or more categorical variables that can be evaluated and registered. It is a categorical version of the scatterplot, which is used to investigate the linear relationship between two variables. A contingency table is indeed a type of frequency distribution table that displays two variables at the same time.
Binomial Distribution
Binomial is an algebraic expression of the sum or the difference of two terms. Before knowing about binomial distribution, we must know about the binomial theorem.
Topic Video
Question
100%
part A
Transcribed Image Text:>>
CENGAGE MINDTAP
Q Search this course
Exam 2
4.
5.
6.
o The Wall Street Journal reported that 33% of taxpayers with adjusted gross incomes between $30,000 and $60,000 itemized deductions on their federal
income tax return. The mean amount of deductions for this population of taxpayers was $16,434. Assume that the standard deviation is o = $2,961. Use
A-Z
7.
z-table.
8.
a. What is the probability that a sample of taxpayers from this income group who have itemized deductions will show a sample mean within $180 of the
o population mean for each of the following sample sizes: 30, 50, 100, and 400? Round your answers to four decimals.
ofce
9.
10.
n = 30
n = 50
n = 100
n = 400
b. What is the advantage of a larger sample size when attempting to estimate the population mean? Round your answers to four decimals.
A larger sample - Select your answer - v the probability that the sample mean will be within a specified distance of the population mean. In the automobile
insurance example, the probability of being within ±180 of u ranges from
for a sample of size 30 to
for a sample of size 400.
O- Icon Key
O * 9 2 4 O 8
Expert Solution
This question has been solved!
Explore an expertly crafted, step-by-step solution for a thorough understanding of key concepts.

This is a popular solution!

Trending now
This is a popular solution!

Step by step
Solved in 5 steps with 39 images

Knowledge Booster


Learn more about
Need a deep-dive on the concept behind this application? Look no further. Learn more about this topic, probability and related others by exploring similar questions and additional content below.Recommended textbooks for you
Glencoe Algebra 1, Student Edition, 9780079039897…
Algebra
ISBN:
9780079039897
Author:
Carter
Publisher:
McGraw Hill
Glencoe Algebra 1, Student Edition, 9780079039897…
Algebra
ISBN:
9780079039897
Author:
Carter
Publisher:
McGraw Hill