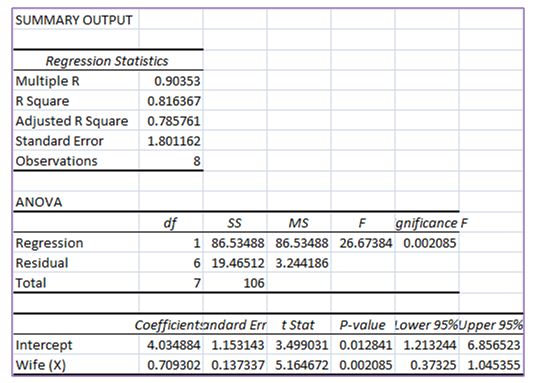
There is a strong relationship between heterosexual couples attractiveness scores. Therefore, a researcher wanted to determine if husbands attractiveness score may be predicted from their counterparts’ scores. Below are couples attractiveness ratings. Observation Wife (X) Husband (Y) 1 11 14 2 6 7 3 16 15 4 4 7 5 1 3 6 10 9 7 5 9 8 3 8 1. Determine the slope of the regression line (b) 2. Determine the y-intercept of the regression line (a) 3. Report your regression line equation 4. Determine SS Regression 5. Determine SS Residual/Error 6. complete anova table


Correlation
Correlation defines a relationship between two independent variables. It tells the degree to which variables move in relation to each other. When two sets of data are related to each other, there is a correlation between them.
Linear Correlation
A correlation is used to determine the relationships between numerical and categorical variables. In other words, it is an indicator of how things are connected to one another. The correlation analysis is the study of how variables are related.
Regression Analysis
Regression analysis is a statistical method in which it estimates the relationship between a dependent variable and one or more independent variable. In simple terms dependent variable is called as outcome variable and independent variable is called as predictors. Regression analysis is one of the methods to find the trends in data. The independent variable used in Regression analysis is named Predictor variable. It offers data of an associated dependent variable regarding a particular outcome.
- There is a strong relationship between heterosexual couples attractiveness scores. Therefore, a researcher wanted to determine if husbands attractiveness score may be predicted from their counterparts’ scores. Below are couples attractiveness ratings.
|
Observation |
Wife (X) |
Husband (Y) |
|
1 |
11 |
14 |
|
2 |
6 |
7 |
|
3 |
16 |
15 |
|
4 |
4 |
7 |
|
5 |
1 |
3 |
|
6 |
10 |
9 |
|
7 |
5 |
9 |
|
8 |
3 |
8 |
1. Determine the slope of the regression line (b)
2. Determine the y-intercept of the regression line (a)
3. Report your regression line equation
4. Determine SS Regression
5. Determine SS Residual/Error
6. complete anova table
It is given that is a strong relationship between heterosexual couples attractiveness scores. The data is about simple linear regression. There are two variables.
Independent variable is “Wife”.
Dependent variable is “Husband”.
Here, the researcher testing whether the husbands attractiveness score may be predicted from their counterparts’ scores or not.
EXCEL (Data Analysis) Procedure:
Step 1: In EXCEL sheet, enter Wife in one column and enter Husband in one column.
Step 2: In Data, select Data Analysis and choose Regression.
Step 3: In Input Variable Y Range: select Husband.
Step 4: In Input Variable X Range: select Wife.
Step 5: Select Lables. Click Ok.
EXCEL (Data Analysis) output:

Step by step
Solved in 3 steps with 1 images


