This graph represents a standard curve from a BCA assay for protein concentration. If your BCA reaction with your unknown protein has an absorbance of 0.2, approximately what concentration of protein is in your unknown sample? Absorbance (562nm) 0.5 0.45 3 0.35 0.3. 0.25 0.15. 0.1- 0.05 [Protein (BSA)) (pg/ml) 10


Q: Differentiate reducing sugars from non-reducing sugars
A: Sugars are carbohydrates or saccharides. Sugars are ketone or aldehyde derivatives of straight-chain…
Q: Consider the following α helix from myoglobin at pH 7.…
A: Proteins are folded polypeptides. Polypeptides are amino acid polymers linked to each other via a…
Q: Describe the role of sodium and phosphomolybdate reagent in Folin Wu method.
A: NOTE : Since you have posted multiple questions, we will provide the solution only to the first…
Q: The peptidyl transferase reaction is an exemplification that the ribosome is a ribozyme. True False
A: Enzymes are bio-catalyst that participate in biochemical process and they are highly specific in…
Q: 21. The structure of D-arabinose is shown below. How many stereoisomers are possible for this…
A: In carbohydrates, the carbon that is attached to four different groups is called a chiral centre.…
Q: 1) Tabulate the differences and/ or similarities of the different kinds of coenzymes and cofactors.…
A: "Since you have asked multiple questions, we will solve the first eight questions subparts for you.…
Q: 2. In the same figure above, identify what is labeled by the letter D. * The 5' carbon The 3' carbon…
A: Ribose is a 5-carbon sugar. To identify the carbons, they are numbered from C1' to C5'. The carbon…
Q: 1. Why is it necessary to calibrate a Pasteur pipette? 2. Cite some possible sources of errors in…
A: Since you have posted multiple questions, we will provide the solution only to the first question as…
Q: Soy milk is rich in vegetable protein (about 4.5 grams of protein per 100 grams of soy milk) and…
A: INTRODUCTION : Proteins : Proteins are simple & complex biocompounds which are needed by the…
Q: 10. Briefly describe and draw the structure of these polysaccharides based on glucose or another…
A: Chemically carbohydrates are polyhydroxy aldehydes or ketones. They have the general formula :…
Q: Draw estimated macroscopic currants for Na and k by multiplying the single channel
A: The sodium-potassium pump is also known as the Na+/K+ ATPase pump. It is a type of active transport…
Q: 8. The amino acid sequence for the beginning of the globular protein myoglobin is:…
A: Proteins are composed of amino acids, which are bound together by peptide linkage. Amino acids…
Q: Uronic acids are another class compound for carbohydrates. a) Describe the structural difference…
A: Chemically carbohydrates are polyhydroxy acetone or ketones. Uronic acids are also carbohydrates…
Q: Which of the following does NOT correctly describe the fluid mosaic model of lipid bilayer? A.…
A: Lipids are biomolecules that do not have a fixed chemical structure like carbohydrates or amino…
Q: Which of the following is NOT a secondary database for structural classification of proteins?…
A: Proteins are polymers of amino acid that have five functional role. Protein databases are…
Q: Which of the following mutations is most likely to cause a loss of protein function? O a. Silent…
A: As per the central dogma of biology, the genetic information stored in the DNA is copied onto an…
Q: 1. Bacteria have a membrane potential, although the mechanisms of how it is maintained differ from…
A: To calculate the number of positive ions needed on the exterior surface of the bacterium to…
Q: 1. What are buffers? 2. Using the pH scale, describe how you can indicate if the blood solution is…
A: Buffers are chemical systems which allows a solution to have a stable pH. Most buffers can help…
Q: 3. Prostaglandins (5) are derived from the 20-carbon fatty acid arachidonic acid in a reaction…
A: In order to solve this problem , we need to draw the Lineweaver Burk plot (LB plot). LB plot has…
Q: all of the following statements about mitochondrial oxidative phosphorylation are true EXCEPT a. The…
A: The metabolic pathway in which cells use enzymes to oxidize nutrients, releasing chemical energy and…
Q: ~0.766+ 47425 y-0.568x46576 . . . . . X The inhibitor binds at the active site. The inhibitor binds…
A: Enzymes are highly specialized proteins that have extraordinary catalytic power, greater than that…
Q: Which of the following statements is NOT true of biological organic molecules? Their atoms are…
A: “Since you have posted multiple questions, we will provide the solution only to the first question…
Q: Draw an approximate titration curve for lysine, given that its pKa(COOH) = 2.18, its pKa(NH3*) =…
A: Amino acid has a typical structure. It has a central Carbon atom called (Cα). To it 4 groups are…
Q: For the reaction 4 A + 5 B → 2C+ 3 D, what is the magnitude of the rate of change for [D] when [A]…
A: According to law of chemical kinetics, the rate of product formation is directly proportional to the…
Q: Calculate the more fraction of HC! hydrochloric water containing 30% HCl and water in a folution…
A: Mole fraction is a fraction of the number of moles of a particular component in a mixture divided by…
Q: Give other chromatographic techniques that can be used for separating non-polar biomolecules, such…
A: Introduction: Chromatography is a method for separating a mixture in the laboratory. The mixture is…
Q: A. hand-draw the chemical structures of dipalmitoyl phosphatidyl choline, DPPC (also known as…
A: Lipids are classified into charged and neutral lipids based on the presence of phosphate group.…
Q: What are the two monosaccharides that make up this structure? H₂N НО CH3 OH OH H NH₂ N
A: Carbohydrates or carbs are maconutrient consisting of Carbon, hydrogen and oxygen atoms. In nature…
Q: Write schematically the synthesis of phosphatidylethanolamine through the activation of amino…
A: INTRODUCTION : Phospholipids : They are a group of biochemical compounds which are made up of fatty…
Q: To completely reduce an oxidized cytochrome-c, how many electrons are required?
A: The electrons transport chain is a collection of four protein complexes: complex I, II, III and IV…
Q: Question 3 Matching. Some answer(s) could be matched more than once to a question. ✓ Patients'…
A: After a meal, there is a surplus supply of glucose in the blood. this causes the pancreas to secrete…
Q: 4. At pH 9.5, what is the net charge of the peptide LTDQRHGE?
A: Peptide is composed of polymer of amino acids (length of 13 to 17 amino acids) which is linked by…
Q: Two common methods of denaturing proteins in the lab are to increase the temperature and/or add…
A: Proteins are biomolecules with diverse biological roles. The function of a protein depends on its…
Q: What are the buffering ranges for this titration curve? Please tell the ranges and indicate on the…
A: Titration is a lab procedure that is used for determining the amount of acid in a solution. Sodium…
Q: 3. Please draw the core structure of Lignan, and numbering the C-atoms.
A: In 1948, Haworth first introduced the term "Lignan", which are also subgroup of non-flavonoid…
Q: Serine proteases are involved in the control of blood coagulation, fibrinolysis, complement…
A: Serine proteases - are enzymes which cleaves peptide bond by formation of catalytic triads and Ser…
Q: 2. To track the insulin purification process, the ratio of insulin to total protein is tracked…
A: To study the physical and chemical properties of insulin, it must be separated from the mixture of…
Q: PJA01 Based on your knowledge of local anesthetic SAR, which of the following drugs will block the…
A: Local anesthetics (LA) are drugs that block the sensation of pain caused by injury or a surgery.…
Q: 3. Some proteins are membrane bound and have segments (called transmembrane domains) that pass…
A: There are different proteins associated with lipid bilayer and they perform different functions.…
Q: 3. A. Briefly discuss the four levels of structure in proteins. Knowing that the 3-dimensional shape…
A: Protein is a polypeptide made up of amino acids. The sequence of amino acids determines the…
Q: 9. Compartmentation in ß Oxidation Free palmitate is activated to its coenzyme A derivative…
A: Beta oxidation is the biochemical pathway by which fatty acids are broken down two carbon at a time…
Q: Reciprocal regulation of opposing pathways is necessary to avoid the wasteful synthesis and…
A: Metabolism is the total of all chemical transformation that takes place in a living cell. One…
Q: In the folded protein, His108 forms a salt bridge with Asp44. The pKa of the imidazole functional…
A: pKa is the pH at which a weak acid is 50% dissociated into H+ and conjugate base. Also, pKa = -log…
Q: Question 7 Which of the following translocases serves as the central entry gate for cytosolic…
A: Mitochondria is a cell organelle whose purpose is to generate ATP via oxidative phosphorylation. It…
Q: what is bioenergetics ?
A: The scientific field of biochemistry focuses on all the chemical and biological processes involved…
Q: A 24-residue peptide called Pandinin 2, isolated from scorpion venom, was found to have both…
A: Proteins are composed of amino acids, which are bound together by peptide linkage. Amino acids…
Q: Which steps in eukaryotic translation require the cleavage of a phosphodiester bond from GTP? Choose…
A: Eukaryotic translation is the process by which eukaryotes synthesize polypeptide chains with respect…
Q: c. In lab, you recorded a UV-Vis spectrum of a mixture of proteins. What best explains why two major…
A: (c). Every substance absorbs a certain amount of energy, when a light of particular intensity…
Q: 4 Using the structures you drew in questions 2 & 3, for each of the organic functional groups listed…
A: The structures of the compounds from questions 2 and 3 are given below (lecithin) The…
Q: Assuming the average weight of a deoxynucleotide monophosphate (dNMP) is 327.0 g/mol, how many…
A: Nucleic acids primarily act as transmitters and stores genetic information. DNA is the chemical…
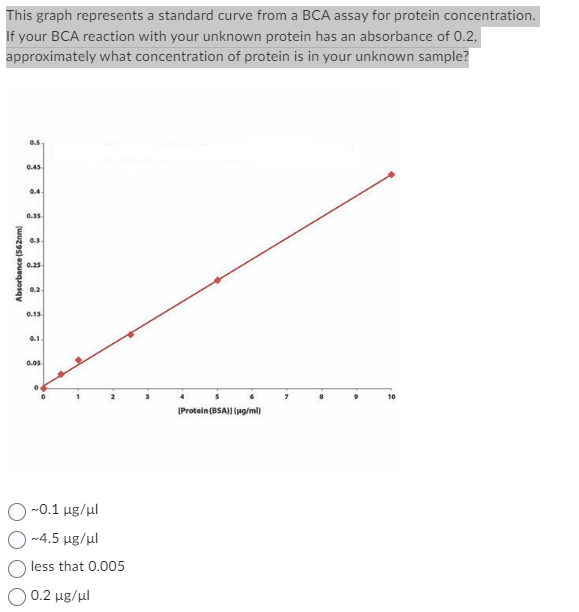
Standard curve can be constructed by using the known concentrations of a sample and their corresponding absorbance values.
This standard curve can be used to determine the concentration of unknown sample by comparing its absorbance value with the known reference values .

Trending now
This is a popular solution!

Step by step
Solved in 2 steps with 1 images

- I need to prepare a standard calibration curve for gamma globulin. absorbances on Y and mg of standard protein per assay on X. used 0.1mg/ml gamma stock for tubes 2-6. (Water (ml), gamma (ml), Abosrbance)--> (.036, .004, .290) (.036, .008, .358) (.024, .016, .341) (.016, .024, .520) (.008, .032, .597) - What is the math and how do you get the standard curve?You perform a Bradford assay to determine the concentration of isolated α-lactalbumin. You use 50 μL of a two-fold diluted solution of α-lactalbumin in the assay. You generate a standard curve with the following equation for the line: y = 0.163x + 0.082. The absorbance of your sample was 0.674 AU. What is the concentration of α-lactalbumin, in mg/mL, in your sample? Give your answer to three significant figures.Using Bradford Assay, plot the standard curve and find the unknowns. Protein Concentration A595 of sample 0 0 3 0.220 6.5 0.383 12 0.667 18.8 0.930 24.2 1.090 Unknown 1 1.085 Unknown 2 0.708 Unknown 3 0.193
- You obtained the following raw data when setting up a Bradford standard curve: BSA (mg/ml) Absorbancy 595nm 0 0.225 1 0.310 2 0.420 3 0.510 4 0.610 5 0.720 6 0.810 7 0.915 8 0.950 9 0.980 10 0.990 After blanking against a bradford-dH2O sample, the protein concentration of an unknown sample was determined using the same method and an absorbancy of 0.570 was obtained. Set up a standard curve, excluding outliers (experimental and statistical) and determine the protein concentration in the unknown sample in mg / ml (up to 3 significant figures).1.0 ml of serum albumin (BSA) solution was precisely diluted to 100 ml with a buffer solution, and the absorbance at 280 nm was measured from this buffer solution at a distance of 1 cm from the light. The result was A=1.0. BSA is 0.1%(=0.1g/l). The absorptivity is e(0.1%)=0.667, so 1g/l solution gives an absorbance of 0.667. What was the original protein content? Report in the result unit mg/ml with an accuracy of 0.1 mg.In the experiment performed for the determination of cholesterol, the function of the calibration curve obtained using 25-400mg/dL standard cholesterol solutions was determined as y= 0.0009x. If the absorbance of the serum sample is determined as 0.28, what is the amount of cholesterol in the sample, in mg/L?
- You obtained the following raw data when setting up a Biuret standard curve: BSA (mg/ml) Absorbancy 540nm 0 0.158 1 0.210 2 0.260 3 0.305 4 0.360 5 0.410 6 0.455 7 0.510 8 0.530 9 0.550 10 0.554 After blanking against a biuret-dH2O sample, the protein concentration of an unknown sample was determined using the same method and an absorbancy of 0.284 was obtained. Set up a standard curve, excluding outliers (experimental and statistical) and determine the protein concentration in the unknown sample in mg / ml (up to 3 significant figures).Using the equation for the best-fit straight line through your data, the average absorbance of your unknown samples U1 and U2, and any dilution factors (DON’T LEAVE OUT THE DILUTION FACTOR), calculate the concentration of protein in the original unknown protein sample. y = 1.6849x + 0.0414R² = 0.99044 mL of 10% TCA solution was added to 1 mL of serum and after mixing, it was waited for two minutes and filtered through non-phosphorus filter paper. 1 mL of the filtrate was taken and 13 mL of distilled water, 4 mL of sulfomolybdic acid and 2 mL of dilute SnCl2 solution were added and mixed, and after waiting for 15 minutes, the absorbances of the obtained solutions against pure water at 520 nm were read. If the function of the calibration graph obtained with 0.5-2.5 mg/mL standard phosphorus solutions is y= 0.245x + 0.107 and the absorbance value of the serum sample is 0.109, what is the amount of phosphorus in the sample?
- In the experiment performed for the determination of cholesterol, the function of the calibration curve obtained using 25-400mg/dL standard cholesterol solutions was determined as y= 0.0009x. If the amount of cholesterol in the serum sample is determined as 3.11 g/L, what is the absorbance value of the sample? A. 0,280 B. 0.028 C. 0.208 D. 0.82From this standard curve and chart below, does the separation of molecules in the mixture appear successful from the gel filtration? Is there a clearlydefined separation between molecules? Explain your conclusions. Parameters required for calculation of coefficient (Kd) for unknown protein Volume eluted (mL) Which variable does this volume represent in the equation for Kd? Fraction with maximal DNP-Aspartate detected 36 Vt Fraction with maximal Protein detected 24 Ve Fraction with maximal Blue dextran detected 6 VoWhat is the approximate rate of change of A340 measured? i.e. ΔA340 / min = __________ What rate of change of A340 would you predict if 30 ml of the ADH solution was tested in the same way (i.e. half the amount of protein) ? i.e. ΔA340 / min = __________ What rate of change of A340 would you predict if 60 ml of a 0.5 μM ADH solution was tested in the same way? i.e. ΔA340 / min = __________ As well as writing your answers, explain your reasoning.