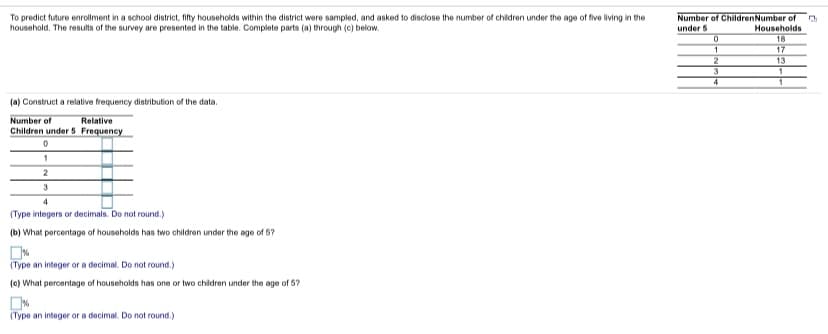
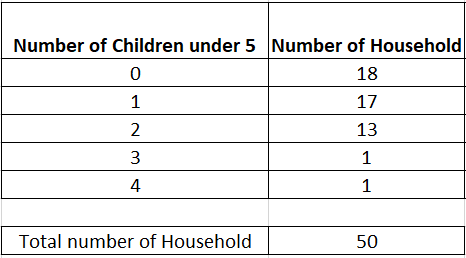
To predict future enrollment in a school district, fifty households within the district were sampled, and asked to disclose the number of children under the age of five living in the household. The results of the survey are presented in the table. Complete parts (a) through (e) below. Number of ChildrenNumber of under 5 Households 18 17 2 3 4 13 (a) Construct a relative frequency distribution of the data. Relative Children under 5 Frequency Number of 3 4 (Type integers or decimals. Do not round.) (b) What percentage of households has two children under the age of 5? (Type an integer or a decimal. Do not round.) (e) What percentage of households has one or two children under the age of 5? (Type an integer or a decimal. Do not round.)
To predict future enrollment in a school district, fifty households within the district were sampled, and asked to disclose the number of children under the age of five living in the household. The results of the survey are presented in the table. Complete parts (a) through (e) below. Number of ChildrenNumber of under 5 Households 18 17 2 3 4 13 (a) Construct a relative frequency distribution of the data. Relative Children under 5 Frequency Number of 3 4 (Type integers or decimals. Do not round.) (b) What percentage of households has two children under the age of 5? (Type an integer or a decimal. Do not round.) (e) What percentage of households has one or two children under the age of 5? (Type an integer or a decimal. Do not round.)
Glencoe Algebra 1, Student Edition, 9780079039897, 0079039898, 2018
18th Edition
ISBN:9780079039897
Author:Carter
Publisher:Carter
Chapter10: Statistics
Section10.4: Distributions Of Data
Problem 19PFA
Related questions
Question
100%

Transcribed Image Text:To predict future enrlment in a school district, fifty households within the district were sampled, and asked to disclose the number of children under the age of five living in the
household. The results of the survey are presented in the table. Complete parts (a) through (c) below.
Number of ChildrenNumber of
under 5
Households
18
17
13
(a) Construct a relative frequency distribution of the data.
Number of
Relative
Children under 5 Frequency
2
3
(Type integers or decimals. Do not round.)
(b) What percentage of households has two children under the age of 5?
(Type an integer or a decimal. Do not round.)
(c) What percentage of households has one or two children under the age of 5?
(Type an integer or a decimal. Do not round.)
Expert Solution
Step 1
Given,

The basic formula for the relative frequency:
Relative frequency =Frequency of particular children / Total number of frequency
Trending now
This is a popular solution!
Step by step
Solved in 2 steps with 2 images

Knowledge Booster
Learn more about
Need a deep-dive on the concept behind this application? Look no further. Learn more about this topic, statistics and related others by exploring similar questions and additional content below.Recommended textbooks for you

Glencoe Algebra 1, Student Edition, 9780079039897…
Algebra
ISBN:
9780079039897
Author:
Carter
Publisher:
McGraw Hill

Glencoe Algebra 1, Student Edition, 9780079039897…
Algebra
ISBN:
9780079039897
Author:
Carter
Publisher:
McGraw Hill