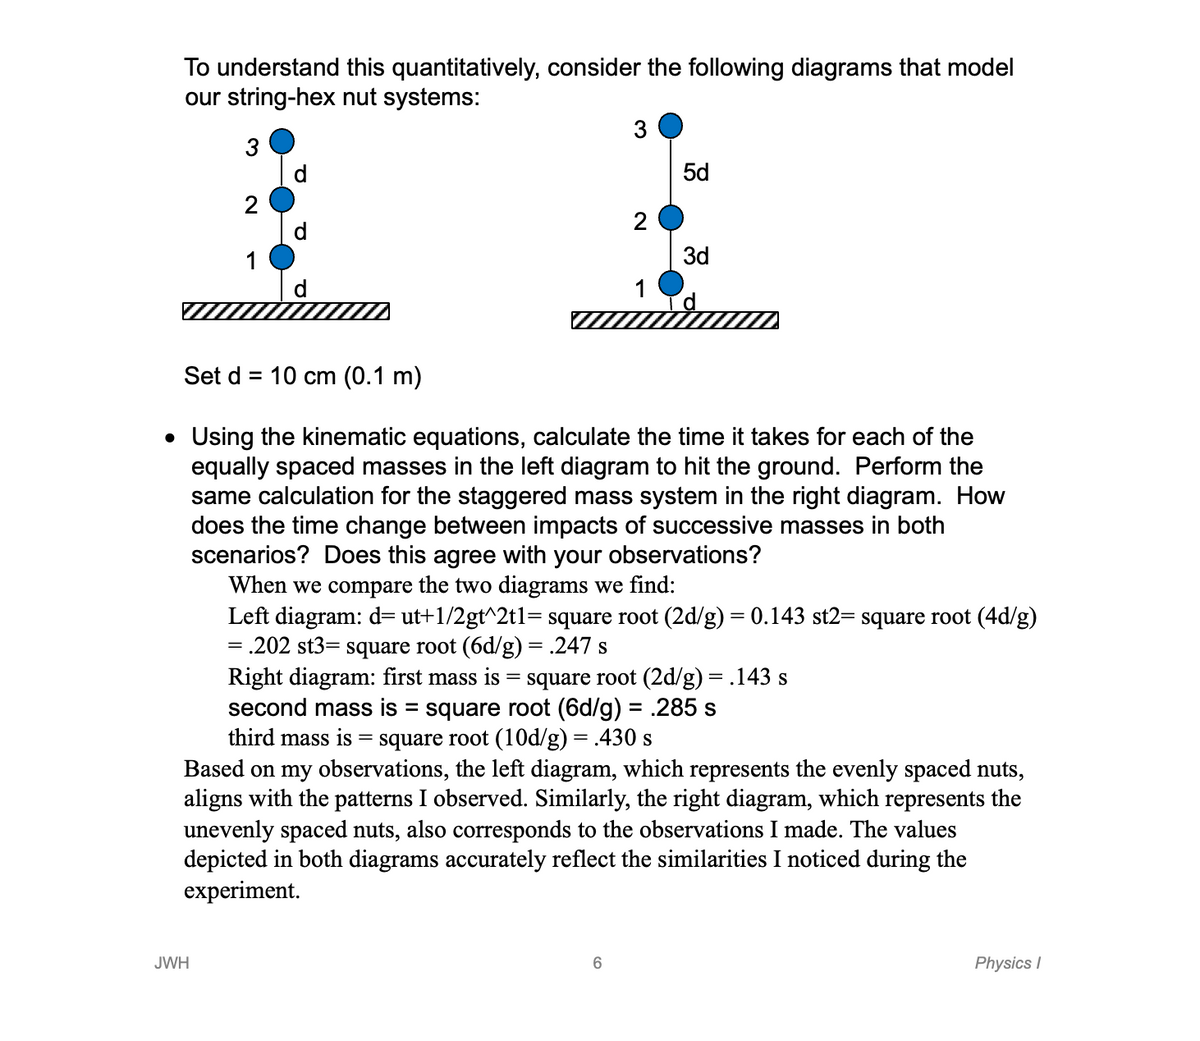
To understand this quantitatively, consider the following diagrams that model our string-hex nut systems: 3 2 1 d d d 3 2 1 5d 3d Set d = 10 cm (0.1 m) Using the kinematic equations, calculate the time it takes for each of the equally spaced masses in the left diagram to hit the ground. Perform the same calculation for the staggered mass system in the right diagram. How does the time change between impacts of successive masses in both scenarios? Does this agree with your observations? When we compare the two diagrams we find: Left diagram: d= ut+1/2gt^2t1= square root (2d/g) = 0.143 st2= square root (4d/g) = .202 st3= square root (6d/g) = .247 s Right diagram: first mass is = square root (2d/g) = .143 s second mass is = square root (6d/g) = .285 s third mass is = square root (10d/g) = .430 s Based on my observations, the left diagram, which represents the evenly spaced nuts, aligns with the patterns I observed. Similarly, the right diagram, which represents the unevenly spaced nuts, also corresponds to the observations I made. The values depicted in both diagrams accurately reflect the similarities I noticed during the experiment.
To understand this quantitatively, consider the following diagrams that model our string-hex nut systems: 3 2 1 d d d 3 2 1 5d 3d Set d = 10 cm (0.1 m) Using the kinematic equations, calculate the time it takes for each of the equally spaced masses in the left diagram to hit the ground. Perform the same calculation for the staggered mass system in the right diagram. How does the time change between impacts of successive masses in both scenarios? Does this agree with your observations? When we compare the two diagrams we find: Left diagram: d= ut+1/2gt^2t1= square root (2d/g) = 0.143 st2= square root (4d/g) = .202 st3= square root (6d/g) = .247 s Right diagram: first mass is = square root (2d/g) = .143 s second mass is = square root (6d/g) = .285 s third mass is = square root (10d/g) = .430 s Based on my observations, the left diagram, which represents the evenly spaced nuts, aligns with the patterns I observed. Similarly, the right diagram, which represents the unevenly spaced nuts, also corresponds to the observations I made. The values depicted in both diagrams accurately reflect the similarities I noticed during the experiment.

College Physics
11th Edition
ISBN:9781305952300
Author:Raymond A. Serway, Chris Vuille
Publisher:Raymond A. Serway, Chris Vuille
Chapter1: Units, Trigonometry. And Vectors
Section: Chapter Questions
Problem 1CQ: Estimate the order of magnitude of the length, in meters, of each of the following; (a) a mouse, (b)...

Related questions
Question
CANNOT BE HAND-WRITTEN - MUST BE TYPED
Part 2: Calculate the time for each hex nut to drop using the equation given (has a square root). Use 3 decimal places. Example: In both strings the first nut drops 0.1m and this gives a time of 0.143 sec.
Then calculate the time between impacts. The first interval of time is equal to the time for the 2nd nut to drop - time for the first nut to drop. Continue the process to get all the intervals and put those into tables for each string on hex nuts.
Professor indicated my work is incorrect/needs improvement please help, thank you!
Transcribed Image Text:To understand this quantitatively, consider the following diagrams that model
our string-hex nut systems:
3
d
JWH
5d
Set d = 10 cm (0.1 m)
• Using the kinematic equations, calculate the time it takes for each of the
equally spaced masses in the left diagram to hit the ground. Perform the
same calculation for the staggered mass system in the right diagram. How
does the time change between impacts of successive masses in both
scenarios? Does this agree with your observations?
When we compare the two diagrams we find:
Left diagram: d= ut+1/2gt^2t1= square root (2d/g) = 0.143 st2= square root (4d/g)
= .202 st3= square root (6d/g) = .247 s
3d
Right diagram: first mass is = square root (2d/g) = .143 s
second mass is = square root (6d/g) = .285 s
third mass is = square root (10d/g) = .430 s
Based on my observations, the left diagram, which represents the evenly spaced nuts,
aligns with the patterns I observed. Similarly, the right diagram, which represents the
unevenly spaced nuts, also corresponds to the observations I made. The values
depicted in both diagrams accurately reflect the similarities I noticed during the
experiment.
6
Physics I
Expert Solution
This question has been solved!
Explore an expertly crafted, step-by-step solution for a thorough understanding of key concepts.

This is a popular solution!

Trending now
This is a popular solution!

Step by step
Solved in 4 steps with 3 images

Knowledge Booster


Learn more about
Need a deep-dive on the concept behind this application? Look no further. Learn more about this topic, physics and related others by exploring similar questions and additional content below.Recommended textbooks for you
College Physics
Physics
ISBN:
9781305952300
Author:
Raymond A. Serway, Chris Vuille
Publisher:
Cengage Learning

University Physics (14th Edition)
Physics
ISBN:
9780133969290
Author:
Hugh D. Young, Roger A. Freedman
Publisher:
PEARSON

Introduction To Quantum Mechanics
Physics
ISBN:
9781107189638
Author:
Griffiths, David J., Schroeter, Darrell F.
Publisher:
Cambridge University Press
College Physics
Physics
ISBN:
9781305952300
Author:
Raymond A. Serway, Chris Vuille
Publisher:
Cengage Learning
University Physics (14th Edition)
Physics
ISBN:
9780133969290
Author:
Hugh D. Young, Roger A. Freedman
Publisher:
PEARSON
Introduction To Quantum Mechanics
Physics
ISBN:
9781107189638
Author:
Griffiths, David J., Schroeter, Darrell F.
Publisher:
Cambridge University Press

Physics for Scientists and Engineers
Physics
ISBN:
9781337553278
Author:
Raymond A. Serway, John W. Jewett
Publisher:
Cengage Learning

Lecture- Tutorials for Introductory Astronomy
Physics
ISBN:
9780321820464
Author:
Edward E. Prather, Tim P. Slater, Jeff P. Adams, Gina Brissenden
Publisher:
Addison-Wesley

College Physics: A Strategic Approach (4th Editio…
Physics
ISBN:
9780134609034
Author:
Randall D. Knight (Professor Emeritus), Brian Jones, Stuart Field
Publisher:
PEARSON