Trial Time Average Average^ Distance 0.71 Average (: Displacement (m) Displacement (m) 0.73 0.72 0.52 0.1 3 0.73 0.72 0.1 0.9 1.18 1.12 0.2 0.8 1.09 1.12 1.26 0.2 1.29 0.3 0.7 3 1.1 1.51 0.4 7 0.6 y = 0.3236x 1.41 1.64 0.5 0.5 1.17 1.29 1.66 0.3 1.73 0.6 0.4 3 1.28 1.76 0.7 0.3 1.59 1.98 0.8 0.2 2 1.5 1.51 2.28 0.4 0.1 1.44 0.5 1.5 2 2.5 1. 1.68 1.56 1.64 2.69 0.5 Average^: Displacement (m) Average Time (s) 3 1.68 1.79 0.52 0.1 Displacement (m) vs. Time (s) Squared 1.51 1.73 3.00 0.6 1.26 0.2 0.9 3 1.9 1.66 0.3 0.8 1.67 2.28 0.4 1.79 1.76 3.10 0.7 2.69 0.5 0.7 3 1.82 3.00 0.6 0.6 2.02 3.10 0.7 0.5 2 1.98 1.98 3.91 0.8 3.91 0.8 0.4 1.93 0.3 0.2 0.1 0.5 1.5 2.5 3.5 4 4.5 Distance (m)

College Physics
10th Edition
ISBN:9781285737027
Author:Raymond A. Serway, Chris Vuille
Publisher:Raymond A. Serway, Chris Vuille
Chapter2: Motion In One Dimension
Section: Chapter Questions
Problem 2P: Light travels at a speed of about 3 103 m/s. (a) How many miles down a pulse of light travel in a...
icon
Related questions
Question
100%

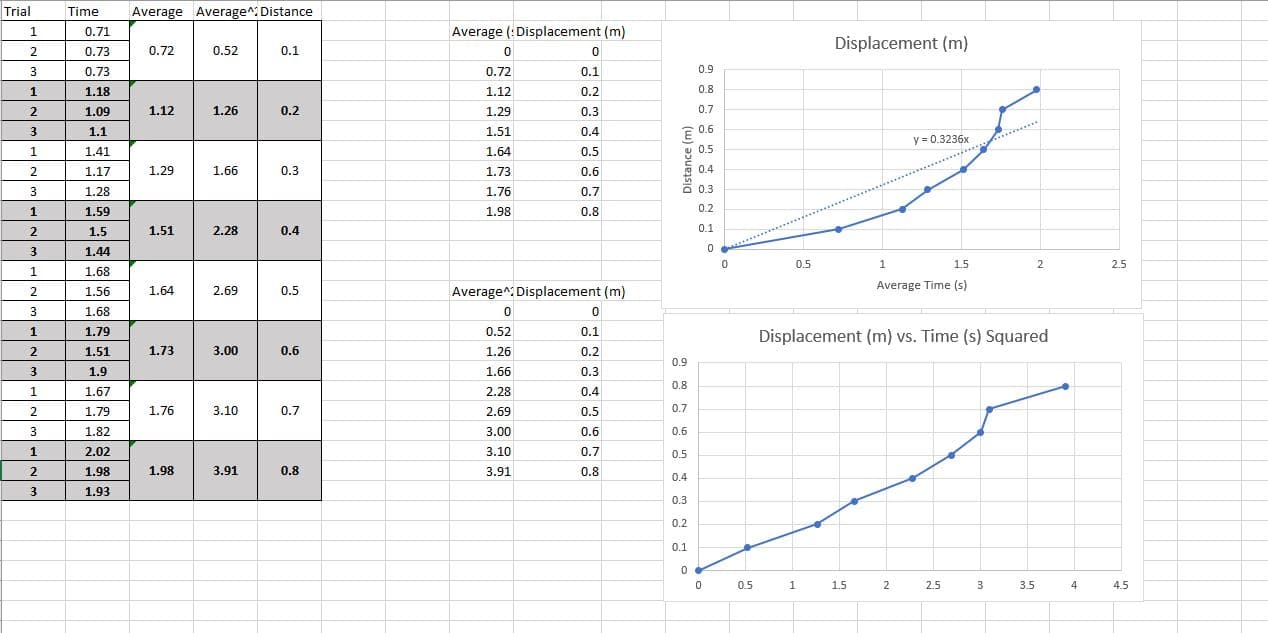
In my assignment, I was asked to perform a lab experiment. I was to take a provided ball and roll it at a given angle at measured increments - 0.1m-.8m. I measured the time in seconds it took to go from 0 to each point - 0-.1, 0-.2, etc. My lab assignment asked me to perform each step three times. I did this, rolling the ball 3 times from 0-0.1 and calculating the time. I used an app on my phone, slowed down, and went to the closest time interval I could for each test. Naturally, my results for each of the 3 tests for all 8 distances was a bit off, as I would expect given my inexperience and inaccuracy of the tools used to begin with. The lab then asks to chart these values - which I inserted a chart of each trial, the time of each trial, and then calculated the average time ((trial 1 + trial 2 + trial 3)/3). The part I am stuck on is that the next activity it asks me for is: "Calculate the square of the average time for each distance, then create a graph of displacement vs. time squared from the data."  In the expanded lab notes, it states that graphing the displacement vs. time data should generate a parabola. However, in my graph, the displacement (0-.8m) compared to the square of the average time (s2) is providing just a more spaced-out version of the same line I achieve by graphing displacement(m) vs. time (s). See the chart attached. Am I misunderstanding a definition or calculation?

Trial
Time
Average Average^ Distance
0.71
Average (: Displacement (m)
Displacement (m)
0.73
0.72
0.52
0.1
3
0.73
0.72
0.1
0.9
1.18
1.12
0.2
0.8
1.09
1.12
1.26
0.2
1.29
0.3
0.7
3
1.1
1.51
0.4
7 0.6
y = 0.3236x
1.41
1.64
0.5
0.5
1.17
1.29
1.66
0.3
1.73
0.6
0.4
3
1.28
1.76
0.7
0.3
1.59
1.98
0.8
0.2
2
1.5
1.51
2.28
0.4
0.1
1.44
0.5
1.5
2
2.5
1.
1.68
1.56
1.64
2.69
0.5
Average^: Displacement (m)
Average Time (s)
3
1.68
1.79
0.52
0.1
Displacement (m) vs. Time (s) Squared
1.51
1.73
3.00
0.6
1.26
0.2
0.9
3
1.9
1.66
0.3
0.8
1.67
2.28
0.4
1.79
1.76
3.10
0.7
2.69
0.5
0.7
3
1.82
3.00
0.6
0.6
2.02
3.10
0.7
0.5
2
1.98
1.98
3.91
0.8
3.91
0.8
0.4
1.93
0.3
0.2
0.1
0.5
1.5
2.5
3.5
4
4.5
Distance (m)
Transcribed Image Text:Trial Time Average Average^ Distance 0.71 Average (: Displacement (m) Displacement (m) 0.73 0.72 0.52 0.1 3 0.73 0.72 0.1 0.9 1.18 1.12 0.2 0.8 1.09 1.12 1.26 0.2 1.29 0.3 0.7 3 1.1 1.51 0.4 7 0.6 y = 0.3236x 1.41 1.64 0.5 0.5 1.17 1.29 1.66 0.3 1.73 0.6 0.4 3 1.28 1.76 0.7 0.3 1.59 1.98 0.8 0.2 2 1.5 1.51 2.28 0.4 0.1 1.44 0.5 1.5 2 2.5 1. 1.68 1.56 1.64 2.69 0.5 Average^: Displacement (m) Average Time (s) 3 1.68 1.79 0.52 0.1 Displacement (m) vs. Time (s) Squared 1.51 1.73 3.00 0.6 1.26 0.2 0.9 3 1.9 1.66 0.3 0.8 1.67 2.28 0.4 1.79 1.76 3.10 0.7 2.69 0.5 0.7 3 1.82 3.00 0.6 0.6 2.02 3.10 0.7 0.5 2 1.98 1.98 3.91 0.8 3.91 0.8 0.4 1.93 0.3 0.2 0.1 0.5 1.5 2.5 3.5 4 4.5 Distance (m)
Expert Solution
trending now

Trending now

This is a popular solution!

steps

Step by step

Solved in 2 steps with 2 images

Blurred answer
Knowledge Booster
Distance and Speed
Learn more about
Need a deep-dive on the concept behind this application? Look no further. Learn more about this topic, physics and related others by exploring similar questions and additional content below.
Similar questions
  • SEE MORE QUESTIONS
Recommended textbooks for you
College Physics
College Physics
Physics
ISBN:
9781285737027
Author:
Raymond A. Serway, Chris Vuille
Publisher:
Cengage Learning
An Introduction to Physical Science
Physics
ISBN:
9781305079137
Author:
James Shipman, Jerry D. Wilson, Charles A. Higgins, Omar Torres
Publisher:
Cengage Learning
Physics for Scientists and Engineers, Technology …
Physics
ISBN:
9781305116399
Author:
Raymond A. Serway, John W. Jewett
Publisher:
Cengage Learning
College Physics
College Physics
Physics
ISBN:
9781938168000
Author:
Paul Peter Urone, Roger Hinrichs
Publisher:
OpenStax College
University Physics Volume 1
Physics
ISBN:
9781938168277
Author:
William Moebs, Samuel J. Ling, Jeff Sanny
Publisher:
OpenStax - Rice University
Glencoe Physics: Principles and Problems, Student…
Physics
ISBN:
9780078807213
Author:
Paul W. Zitzewitz
Publisher:
Glencoe/McGraw-Hill