True, False, or Uncertain. In each of the following situations, state whether each statement is true, false, or uncertain, and explain your answer. Your score is evaluated on the explanation you provide therefore, if you do not provide explanation, you will not receive any credit even if you stated true false, or uncertain correctly 1. As the degrees of freedom k decrease, the t distribution density curve gets closer to the N(0,1) curve a. The standard error of the sample mean is s'/n b. A researcher wants to test Ho:= 30 versus the one sided alternative Ha:< 30 c. d. The 95% margin of error for the mean u of a Normal population with unknown o is the same for all SRS of size n.
True, False, or Uncertain. In each of the following situations, state whether each statement is true, false, or uncertain, and explain your answer. Your score is evaluated on the explanation you provide therefore, if you do not provide explanation, you will not receive any credit even if you stated true false, or uncertain correctly 1. As the degrees of freedom k decrease, the t distribution density curve gets closer to the N(0,1) curve a. The standard error of the sample mean is s'/n b. A researcher wants to test Ho:= 30 versus the one sided alternative Ha:< 30 c. d. The 95% margin of error for the mean u of a Normal population with unknown o is the same for all SRS of size n.

Functions and Change: A Modeling Approach to College Algebra (MindTap Course List)
6th Edition
ISBN:9781337111348
Author:Bruce Crauder, Benny Evans, Alan Noell
Publisher:Bruce Crauder, Benny Evans, Alan Noell
Chapter4: Exponential Functions
Section4.4: Modeling Nearly Exponential Data
Problem 19E: Special Rounding Instructions. For this exercise set, round all regression parameters to three...

Related questions
Question
100%
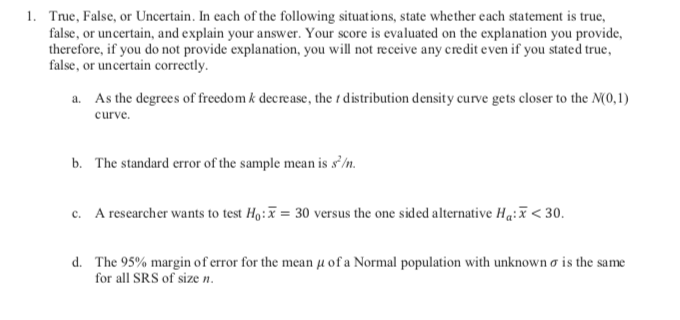
Transcribed Image Text:True, False, or Uncertain. In each of the following situations, state whether each statement is true,
false, or uncertain, and explain your answer. Your score is evaluated on the explanation you provide
therefore, if you do not provide explanation, you will not receive any credit even if you stated true
false, or uncertain correctly
1.
As the degrees of freedom k decrease, the t distribution density curve gets closer to the N(0,1)
curve
a.
The standard error of the sample mean is s'/n
b.
A researcher wants to test Ho:= 30 versus the one sided alternative Ha:< 30
c.
d.
The 95% margin of error for the mean u of a Normal population with unknown o is the same
for all SRS of size n.
Expert Solution
This question has been solved!
Explore an expertly crafted, step-by-step solution for a thorough understanding of key concepts.

This is a popular solution!

Trending now
This is a popular solution!

Step by step
Solved in 4 steps

Recommended textbooks for you
Functions and Change: A Modeling Approach to Coll…
Algebra
ISBN:
9781337111348
Author:
Bruce Crauder, Benny Evans, Alan Noell
Publisher:
Cengage Learning

Algebra & Trigonometry with Analytic Geometry
Algebra
ISBN:
9781133382119
Author:
Swokowski
Publisher:
Cengage

Glencoe Algebra 1, Student Edition, 9780079039897…
Algebra
ISBN:
9780079039897
Author:
Carter
Publisher:
McGraw Hill
Functions and Change: A Modeling Approach to Coll…
Algebra
ISBN:
9781337111348
Author:
Bruce Crauder, Benny Evans, Alan Noell
Publisher:
Cengage Learning
Algebra & Trigonometry with Analytic Geometry
Algebra
ISBN:
9781133382119
Author:
Swokowski
Publisher:
Cengage
Glencoe Algebra 1, Student Edition, 9780079039897…
Algebra
ISBN:
9780079039897
Author:
Carter
Publisher:
McGraw Hill