Туре A B Replaced Repaired Not Returned C 12 3 6 10 8 7 82 96 58 there seem to be a significant difference among the reliabilities of the different radio Does If so, which ones seem to be different? types? The amount of iron present in the livers of white rats is measured after the animals had been fed one of five diets for a prescribed length of time. There were 10 animals randomly 5. assigned to each of the five diets. orands Diet A Diet B Diet C Diet D Diet E 2.23 5.59 4.50 1.35 were 1.40 1.14 0.96 under 3.92 1.06 1.51 2.63 6.96 nked 10.33 0.74 2.49 those 1.00 1.23 8.23 0.96 1.74 TA C2 1.35 1.61 2.07 1.16 1.59 2.01 2.94 4.90 2.08 1.36 pecou gm boa*d 1.64 1.96 6.84 0.69 3.00 1.13 3.68 6.42 4.81 0.68 1.54 1.01 3.72 5.21 0.84 1.70 2.59 5.12 6.00 1.34 Do the different diets appear to affect the amount of iron present in the livers? Twelve volunteers were assigned to each of three weight-reducing plans. The assignment s? 6. of the volunteers to the plans was at random, and it was assumed that the 36 volunteers in all would resemble a random sample of people who might try a weight-reducing program. Test the null hypothesis that there is no difference in the probability distributions of the amount of weight lost under the three programs against the alternative that there is a difference. The results are given as the number of pounds lost by each person. or is Plan C Plan B Plan A 5 17 5 29 17 2 25 15 6 3 25 4 12 32 3 19 25 5 28 24 4 19 4 6 9 b11 36 5 21 26 6 14 7 7 20 e r 8 brs !n PROBLEMS Show that Equations 3 and 5 are equivalent when there are no ties. Find the exact distribution of the Kruskal-Wallis test statistic when Ho is true, n1 3, i=1,2, . . . ,k j-1 (2) Compute Ri for each sample. If the ranks may be assigned in several different ways because several observations are equal to each other, assign the average rank to each of the tied observations, as in the previous test of this chapter. ew Assumptions 1. All samples are random samples from their respective populations. 9r2. In addition to independence within each sample, there is mutual indepen- dence among the various samples. The measurement scale is at least ordinal. 4. Either the k population distribution functions are identical, or else some of the populations tend to yield larger values than other populations do. Test Statistic The test statistic T is defined 1ecpeonn. odalnqo exing sbjan R N(N+ 12 T-3 (3) bac 4 d iina aib sd ni B where N and Ri are defined in Equations 1 and 2, respectively, and where S2 1 N 1 2R(Xj)2- N(N+ 1)2 4 (4) -8.eslorns w! 0e all ranks V4A IRA eldeT 51+A If there are no ties S2 simplifies to N(N + 1)/12, and the test statistic reduces to svy nu 2s R2 - 3(N+ 1) 12 (5) T= N(N+ 1) e -8 If the number of ties is moderate there will be very little difference between Equations 3 and 5, so the simpler Equation 5 may be preferred. Null Distribution The exact distribution of T is given by Table A8 for k = 3 and all ni s 5, but in general the exact distribution is too cumbersome to work with. Therefore the chi-squared distribution with k - 1 degrees of freedom is used as an approximation to the null distribution of T.
Туре A B Replaced Repaired Not Returned C 12 3 6 10 8 7 82 96 58 there seem to be a significant difference among the reliabilities of the different radio Does If so, which ones seem to be different? types? The amount of iron present in the livers of white rats is measured after the animals had been fed one of five diets for a prescribed length of time. There were 10 animals randomly 5. assigned to each of the five diets. orands Diet A Diet B Diet C Diet D Diet E 2.23 5.59 4.50 1.35 were 1.40 1.14 0.96 under 3.92 1.06 1.51 2.63 6.96 nked 10.33 0.74 2.49 those 1.00 1.23 8.23 0.96 1.74 TA C2 1.35 1.61 2.07 1.16 1.59 2.01 2.94 4.90 2.08 1.36 pecou gm boa*d 1.64 1.96 6.84 0.69 3.00 1.13 3.68 6.42 4.81 0.68 1.54 1.01 3.72 5.21 0.84 1.70 2.59 5.12 6.00 1.34 Do the different diets appear to affect the amount of iron present in the livers? Twelve volunteers were assigned to each of three weight-reducing plans. The assignment s? 6. of the volunteers to the plans was at random, and it was assumed that the 36 volunteers in all would resemble a random sample of people who might try a weight-reducing program. Test the null hypothesis that there is no difference in the probability distributions of the amount of weight lost under the three programs against the alternative that there is a difference. The results are given as the number of pounds lost by each person. or is Plan C Plan B Plan A 5 17 5 29 17 2 25 15 6 3 25 4 12 32 3 19 25 5 28 24 4 19 4 6 9 b11 36 5 21 26 6 14 7 7 20 e r 8 brs !n PROBLEMS Show that Equations 3 and 5 are equivalent when there are no ties. Find the exact distribution of the Kruskal-Wallis test statistic when Ho is true, n1 3, i=1,2, . . . ,k j-1 (2) Compute Ri for each sample. If the ranks may be assigned in several different ways because several observations are equal to each other, assign the average rank to each of the tied observations, as in the previous test of this chapter. ew Assumptions 1. All samples are random samples from their respective populations. 9r2. In addition to independence within each sample, there is mutual indepen- dence among the various samples. The measurement scale is at least ordinal. 4. Either the k population distribution functions are identical, or else some of the populations tend to yield larger values than other populations do. Test Statistic The test statistic T is defined 1ecpeonn. odalnqo exing sbjan R N(N+ 12 T-3 (3) bac 4 d iina aib sd ni B where N and Ri are defined in Equations 1 and 2, respectively, and where S2 1 N 1 2R(Xj)2- N(N+ 1)2 4 (4) -8.eslorns w! 0e all ranks V4A IRA eldeT 51+A If there are no ties S2 simplifies to N(N + 1)/12, and the test statistic reduces to svy nu 2s R2 - 3(N+ 1) 12 (5) T= N(N+ 1) e -8 If the number of ties is moderate there will be very little difference between Equations 3 and 5, so the simpler Equation 5 may be preferred. Null Distribution The exact distribution of T is given by Table A8 for k = 3 and all ni s 5, but in general the exact distribution is too cumbersome to work with. Therefore the chi-squared distribution with k - 1 degrees of freedom is used as an approximation to the null distribution of T.

Chapter8: Sequences, Series,and Probability
Section8.7: Probability
Problem 11ECP: A manufacturer has determined that a machine averages one faulty unit for every 500 it produces....

Related questions
Question
Problem 1 in images. Equations (3) and Equations(5) is give in the second image , it’s under the bold Title Test Statistic on the right it says (3) and the same for equation 5, it’s noted by (5)
Transcribed Image Text:Туре
A
B
Replaced
Repaired
Not Returned
C
12
3
6
10
8
7
82
96
58
there seem to be a significant difference among the reliabilities of the different radio
Does
If
so, which ones seem to be different?
types?
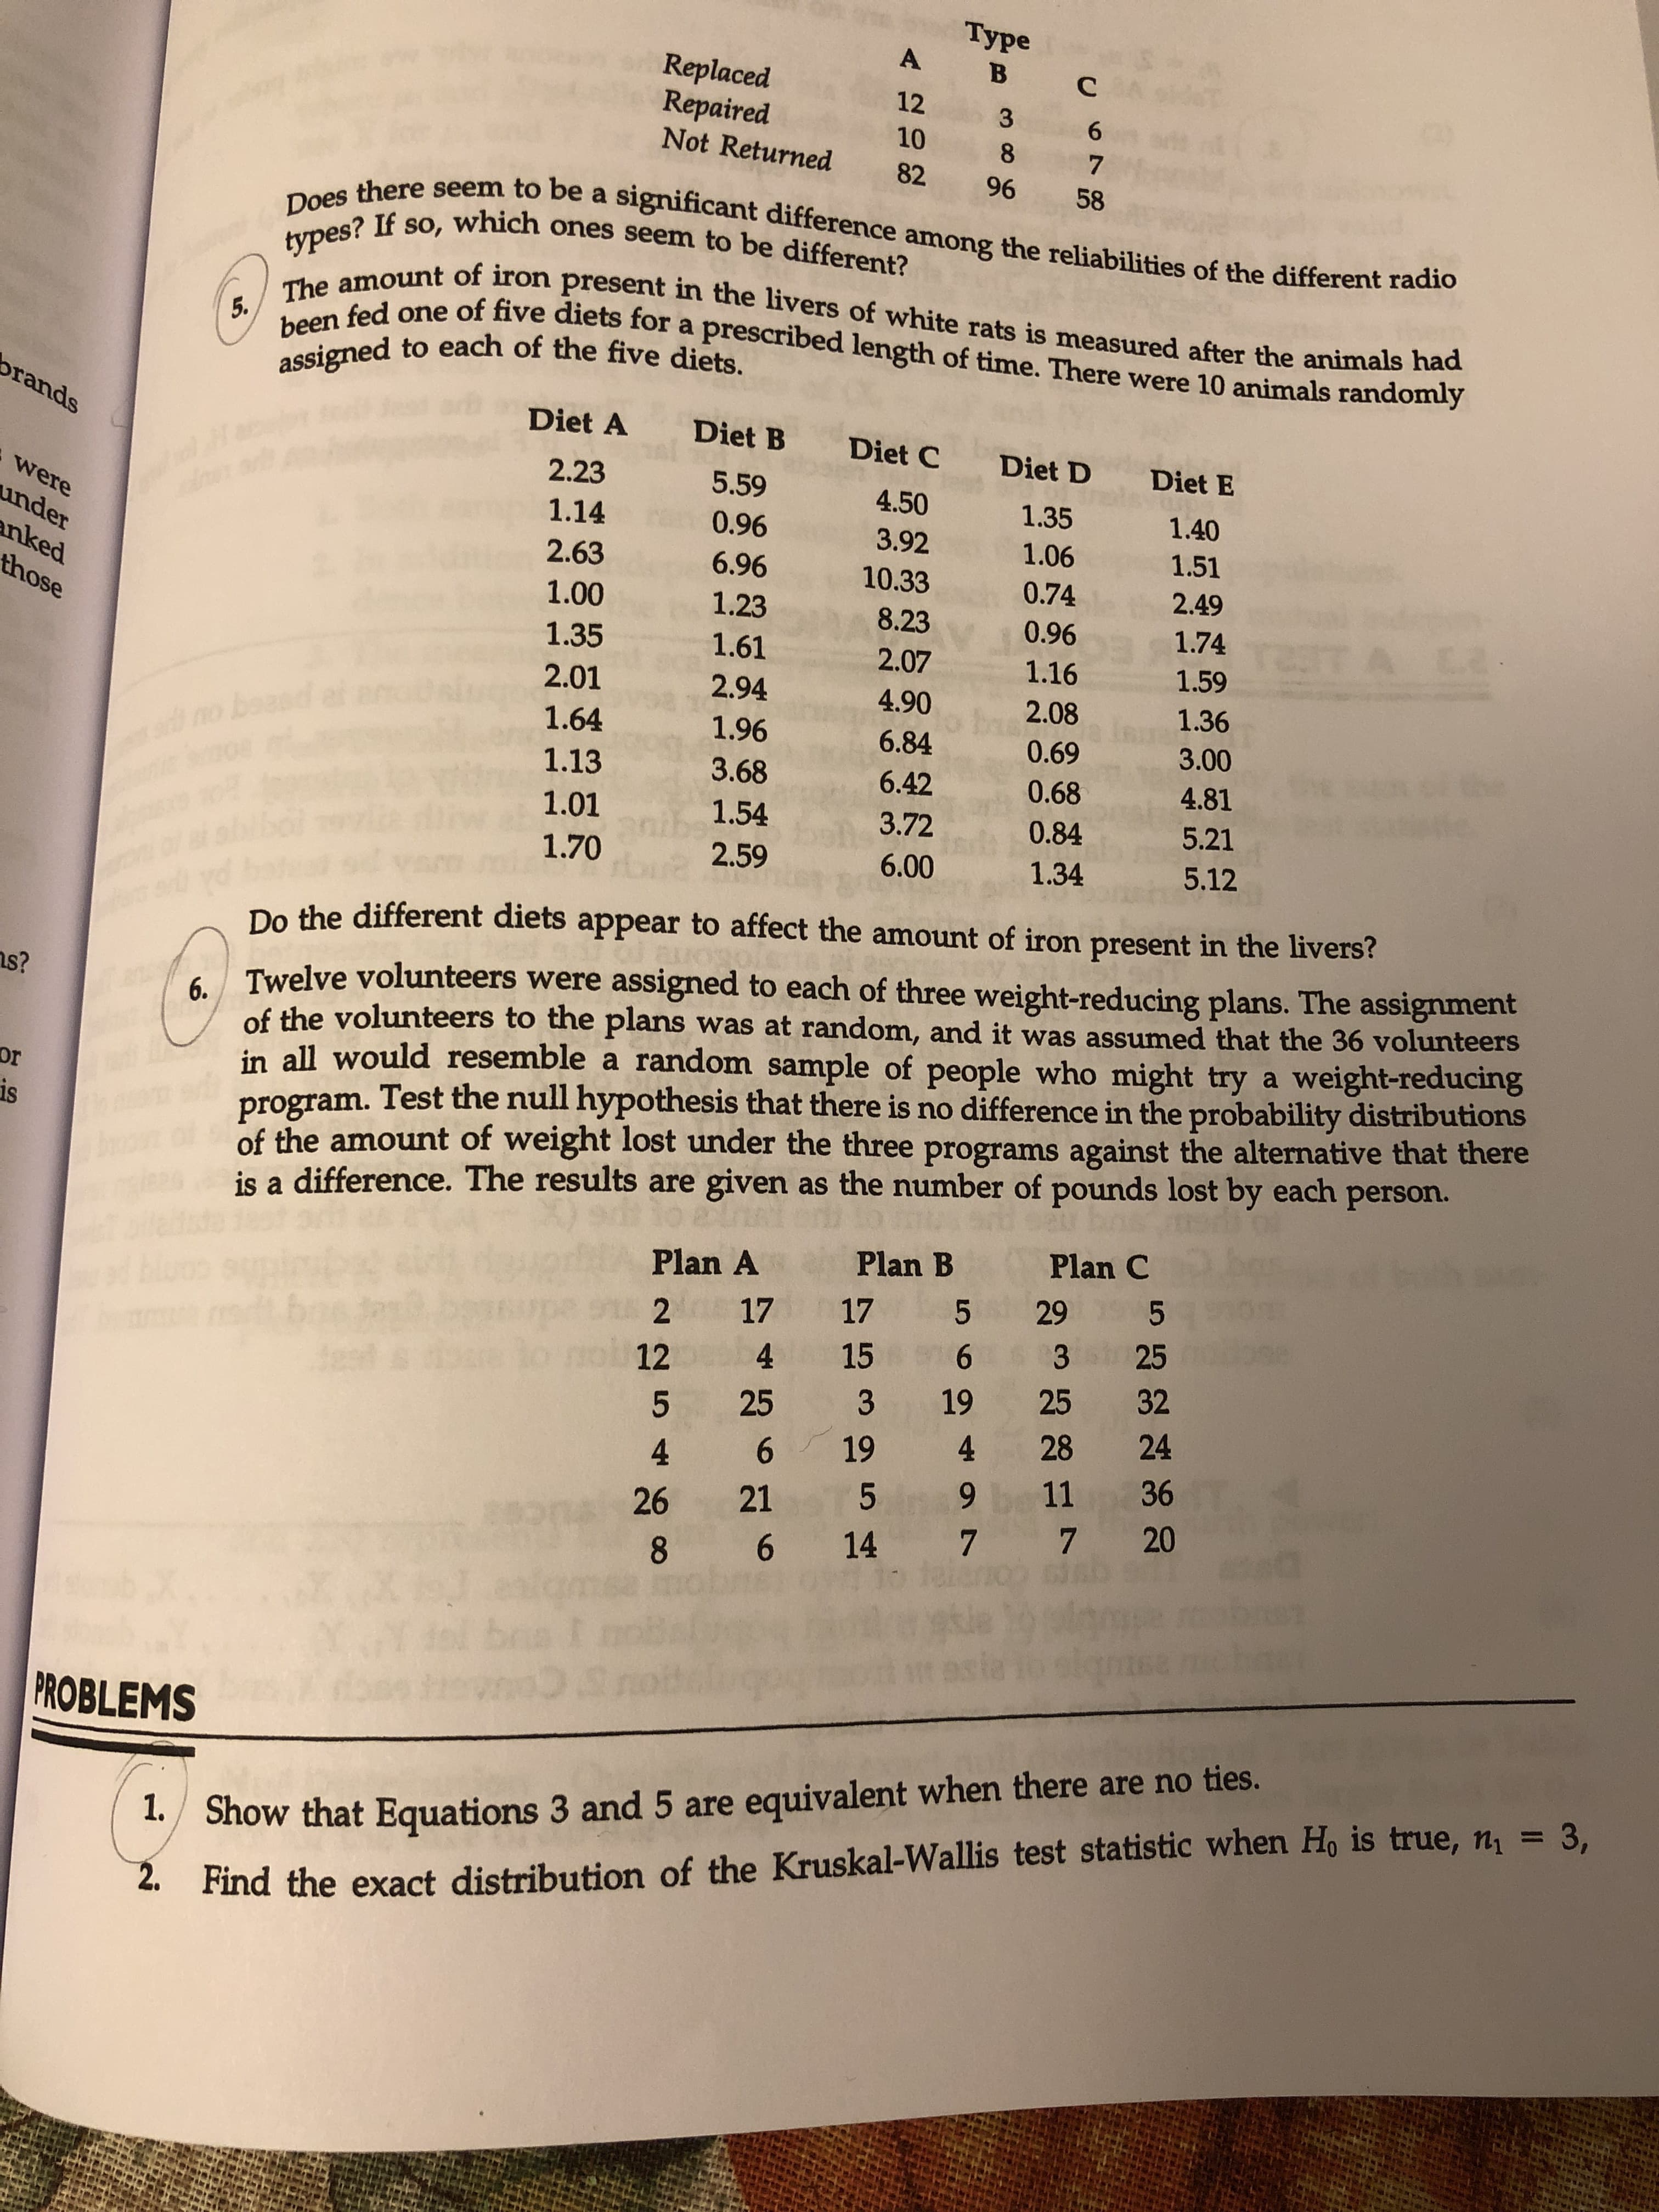
The amount of iron present in the livers of white rats is measured after the animals had
been fed one of five diets for a prescribed length of time. There were 10 animals randomly
5.
assigned to each of the five diets.
orands
Diet A
Diet B
Diet C
Diet D
Diet E
2.23
5.59
4.50
1.35
were
1.40
1.14
0.96
under
3.92
1.06
1.51
2.63
6.96
nked
10.33
0.74
2.49
those
1.00
1.23
8.23
0.96
1.74
TA C2
1.35
1.61
2.07
1.16
1.59
2.01
2.94
4.90
2.08
1.36
pecou gm
boa*d
1.64
1.96
6.84
0.69
3.00
1.13
3.68
6.42
4.81
0.68
1.54
1.01
3.72
5.21
0.84
1.70
2.59
5.12
6.00
1.34
Do the different diets appear to affect the amount of iron present in the livers?
Twelve volunteers were assigned to each of three weight-reducing plans. The assignment
s?
6.
of the volunteers to the plans was at random, and it was assumed that the 36 volunteers
in all would resemble a random sample of people who might try a weight-reducing
program. Test the null hypothesis that there is no difference in the probability distributions
of the amount of weight lost under the three programs against the alternative that there
is a difference. The results are given as the number of pounds lost by each person.
or
is
Plan C
Plan B
Plan A
5
17 5 29
17
2
25
15 6 3
25
4
12
32
3 19
25
5
28 24
4
19
4 6
9 b11 36
5
21
26
6 14 7 7 20
e r
8
brs !n
PROBLEMS
Show that Equations 3 and 5 are equivalent when there are no ties.
Find the exact distribution of the Kruskal-Wallis test statistic when Ho is true, n1 3,
Transcribed Image Text:i=1,2, . . . ,k
j-1
(2)
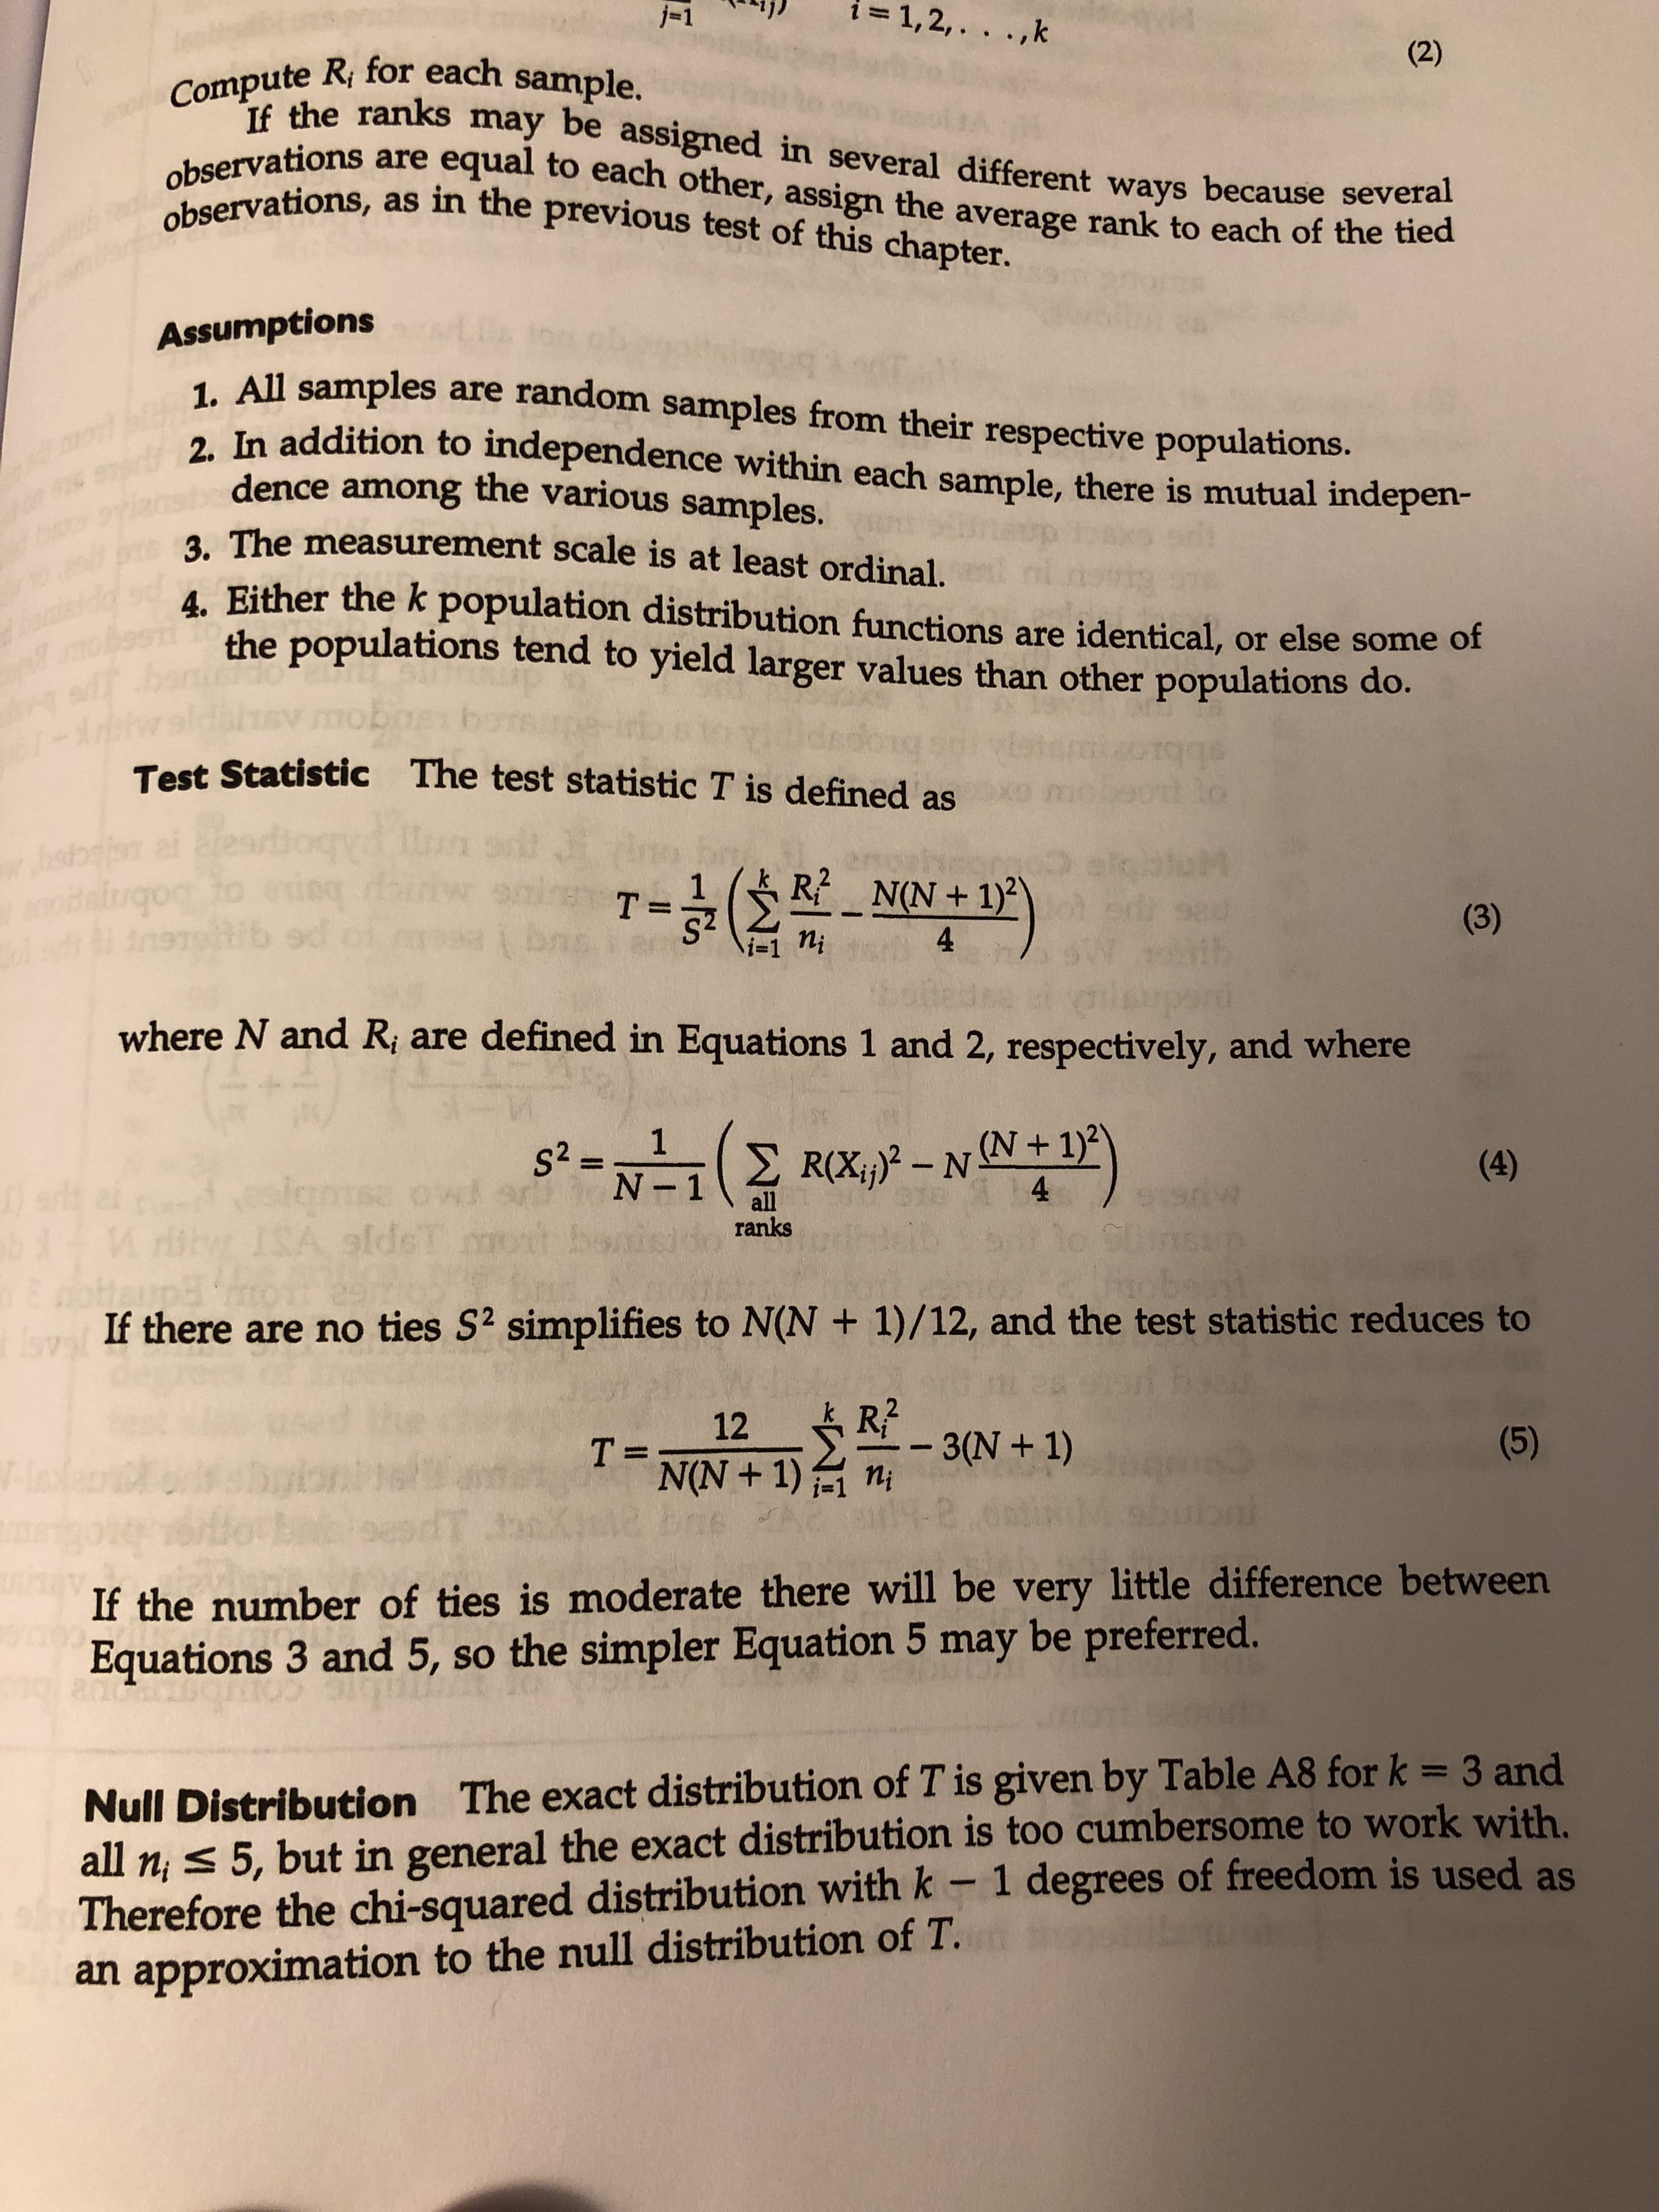
Compute Ri for each sample.
If the ranks may be assigned in several different ways because several
observations are equal to each other, assign the average rank to each of the tied
observations, as in the previous test of this chapter.
ew
Assumptions
1. All samples are random samples from their respective populations.
9r2. In addition to independence within each sample, there is mutual indepen-
dence among the various samples.
The measurement scale is at least ordinal.
4. Either the k population distribution functions are identical, or else some of
the populations tend to yield larger values than other populations do.
Test Statistic
The test statistic T is defined
1ecpeonn.
odalnqo exing
sbjan
R N(N+ 12
T-3
(3)
bac
4
d iina aib sd
ni
B
where N and Ri are defined in Equations 1 and 2, respectively, and where
S2 1
N 1
2R(Xj)2- N(N+ 1)2
4
(4)
-8.eslorns w!
0e
all
ranks
V4A
IRA eldeT
51+A
If there are no ties S2 simplifies to N(N + 1)/12, and the test statistic reduces to
svy
nu 2s
R2
- 3(N+ 1)
12
(5)
T=
N(N+ 1)
e
-8
If the number of ties is moderate there will be very little difference between
Equations 3 and 5, so the simpler Equation 5 may be preferred.
Null Distribution The exact distribution of T is given by Table A8 for k = 3 and
all ni s 5, but in general the exact distribution is too cumbersome to work with.
Therefore the chi-squared distribution with k - 1 degrees of freedom is used as
an approximation to the null distribution of T.
Expert Solution
This question has been solved!
Explore an expertly crafted, step-by-step solution for a thorough understanding of key concepts.

This is a popular solution!

Trending now
This is a popular solution!

Step by step
Solved in 4 steps with 4 images

Knowledge Booster


Learn more about
Need a deep-dive on the concept behind this application? Look no further. Learn more about this topic, statistics and related others by exploring similar questions and additional content below.Recommended textbooks for you