Twenty different statistics students are randomly selected. For each of them, their body temperature (°C) is measured and their head circumference (cm) is measured. a. For this sample of paired data, what does r represent, and what does p represent? b. Without doing any research or calculations, estimate the value of r. c. Does r change if body temperatures are converted to Fahrenheit degrees?
Twenty different statistics students are randomly selected. For each of them, their body temperature (°C) is measured and their head circumference (cm) is measured. a. For this sample of paired data, what does r represent, and what does p represent? b. Without doing any research or calculations, estimate the value of r. c. Does r change if body temperatures are converted to Fahrenheit degrees?

Glencoe Algebra 1, Student Edition, 9780079039897, 0079039898, 2018
18th Edition
ISBN:9780079039897
Author:Carter
Publisher:Carter
Chapter10: Statistics
Section10.5: Comparing Sets Of Data
Problem 26PFA

Related questions

Topic Video
Question
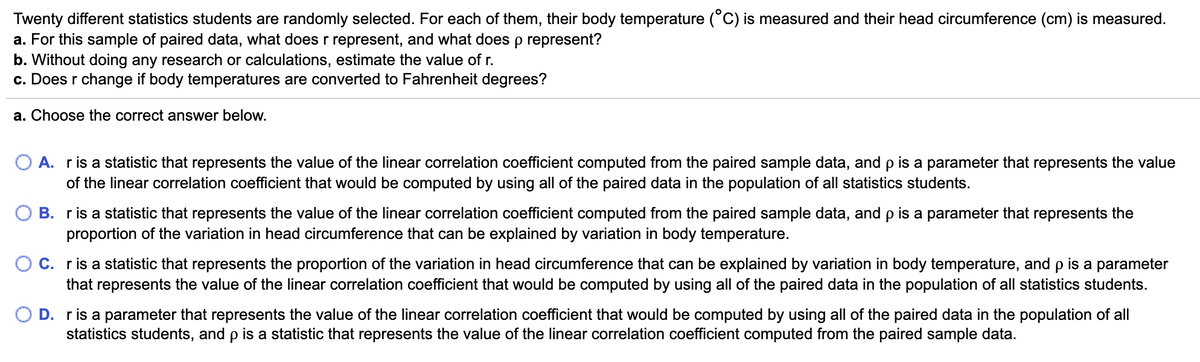
Transcribed Image Text:Twenty different statistics students are randomly selected. For each of them, their body temperature (°C) is measured and their head circumference (cm) is measured.
a. For this sample of paired data, what does r represent, and what doesp represent?
b. Without doing any research or calculations, estimate the value of r.
c. Does r change if body temperatures are converted to Fahrenheit degrees?
a. Choose the correct answer below.
O A. ris a statistic that represents the value of the linear correlation coefficient computed from the paired sample data, and p is a parameter that represents the value
of the linear correlation coefficient that would be computed by using all of the paired data in the population of all statistics students.
B. ris a statistic that represents the value of the linear correlation coefficient computed from the paired sample data, and p is a parameter that represents the
proportion of the variation in head circumference that can be explained by variation in body temperature.
C. ris a statistic that represents the proportion of the variation in head circumference that can be explained by variation in body temperature, and p is a parameter
that represents the value of the linear correlation coefficient that would be computed by using all of the paired data in the population of all statistics students.
D. ris a parameter that represents the value of the linear correlation coefficient that would be computed by using all of the paired data in the population of all
statistics students, and p is a statistic that represents the value of the linear correlation coefficient computed from the paired sample data.
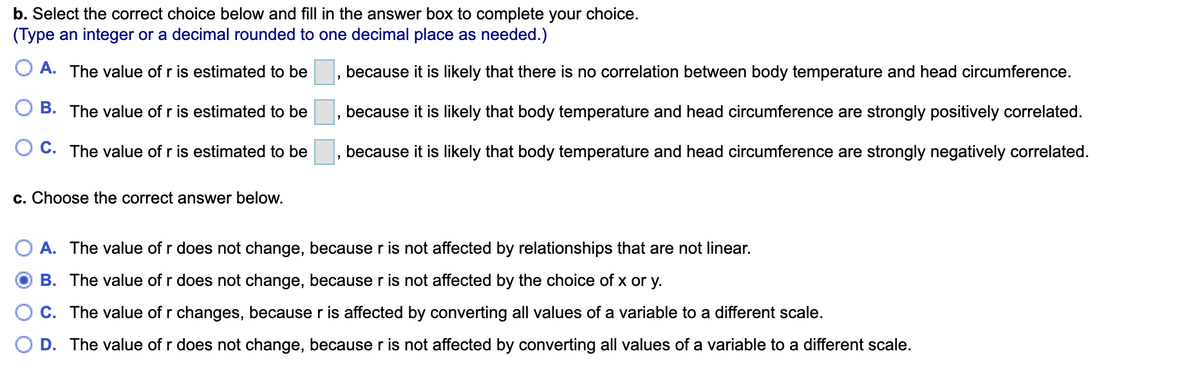
Transcribed Image Text:b. Select the correct choice below and fill in the answer box to complete your choice.
(Type an integer or a decimal rounded to one decimal place as needed.)
O A. The value of r is estimated to be
because it is likely that there is no correlation between body temperature and head circumference.
B. The value of r is estimated to be
because it is likely that body temperature and head circumference are strongly positively correlated.
C. The value of r is estimated to be
because it is likely that body temperature and head circumference are strongly negatively correlated.
c. Choose the correct answer below.
A. The value of r does not change, because r is not affected by relationships that are not linear.
B. The value of r does not change, because r is not affected by the choice of x or y.
C. The value of r changes, because r is affected by converting all values of a variable to a different scale.
O D. The value of r does not change, because r is not affected by converting all values of a variable to a different scale.
Expert Solution
This question has been solved!
Explore an expertly crafted, step-by-step solution for a thorough understanding of key concepts.

This is a popular solution!

Trending now
This is a popular solution!

Step by step
Solved in 2 steps

Knowledge Booster


Learn more about
Need a deep-dive on the concept behind this application? Look no further. Learn more about this topic, statistics and related others by exploring similar questions and additional content below.Recommended textbooks for you
Glencoe Algebra 1, Student Edition, 9780079039897…
Algebra
ISBN:
9780079039897
Author:
Carter
Publisher:
McGraw Hill
Glencoe Algebra 1, Student Edition, 9780079039897…
Algebra
ISBN:
9780079039897
Author:
Carter
Publisher:
McGraw Hill