Two friends are doing a sound experiment: Harry drops a ringing tuning fork off the edge of a cliff. Ron stands at the base and records the frequency of the sound. Ron makes a graph of the frequency he observes as a function of time. Which of the following graphs best represents the frequency which Ron measures? Explain why. Graph 1 Graph 2 Time Time Graph 3 Graph 4 Time Time Frequency Frequency
Two friends are doing a sound experiment: Harry drops a ringing tuning fork off the edge of a cliff. Ron stands at the base and records the frequency of the sound. Ron makes a graph of the frequency he observes as a function of time. Which of the following graphs best represents the frequency which Ron measures? Explain why. Graph 1 Graph 2 Time Time Graph 3 Graph 4 Time Time Frequency Frequency

Related questions
Question
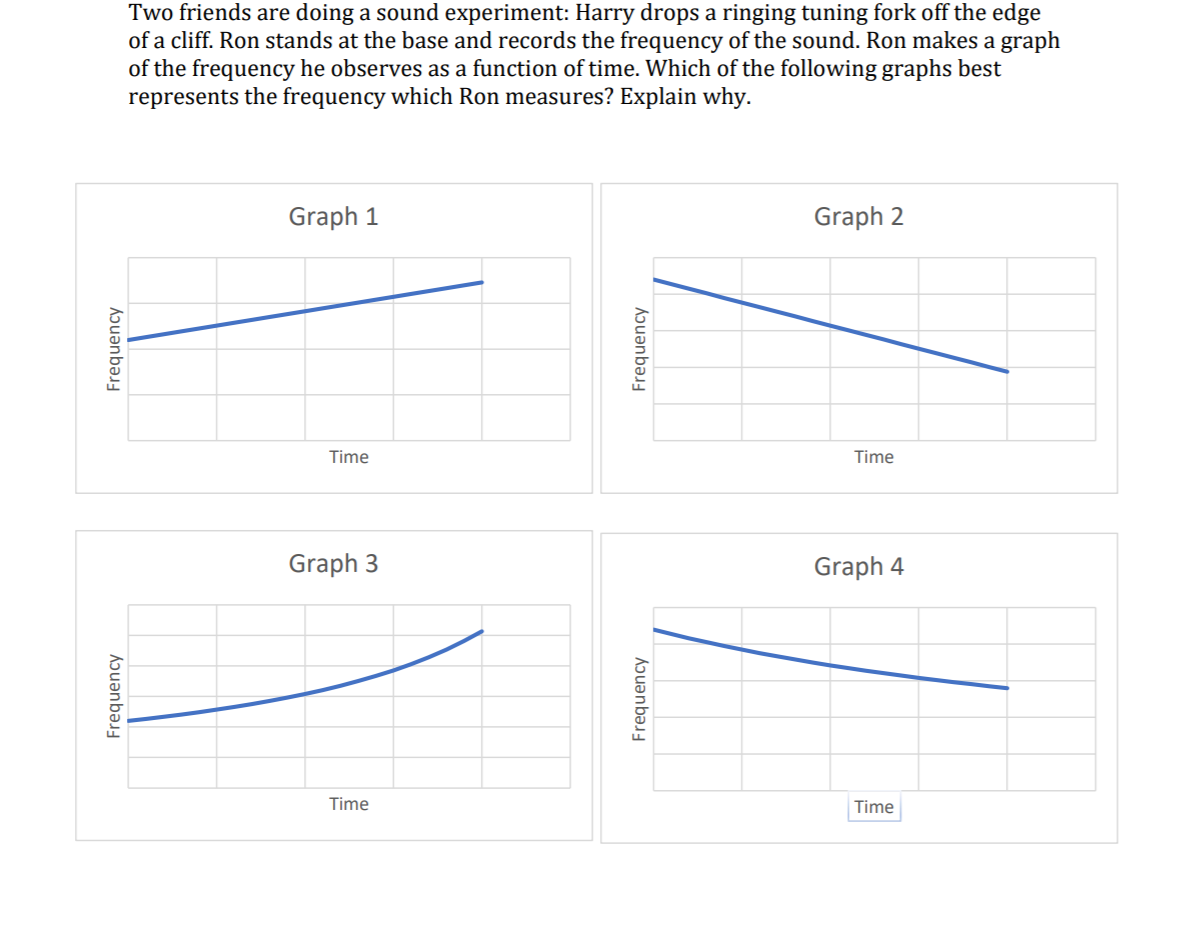
Transcribed Image Text:Two friends are doing a sound experiment: Harry drops a ringing tuning fork off the edge
of a cliff. Ron stands at the base and records the frequency of the sound. Ron makes a graph
of the frequency he observes as a function of time. Which of the following graphs best
represents the frequency which Ron measures? Explain why.
Graph 1
Graph 2
Time
Time
Graph 3
Graph 4
Time
Time
Frequency
Frequency
Frequency
Frequency
Expert Solution
This question has been solved!
Explore an expertly crafted, step-by-step solution for a thorough understanding of key concepts.

This is a popular solution!

Trending now
This is a popular solution!

Step by step
Solved in 3 steps
