Two plots at Rothamsted Experimental Station were studied for production of wheat straw. For a random sumple of years, the annual wheat straw production (in pounds) from one plot was as follows. 6.40 7.03 7.17 6.96 7.31 7.18 7.06 5.79 6.24 5.91 6.14 Use a calculator to verify that, for this plot, the sample variance is sz 0.317. Another random sample of years for a second plot gave the following annual wheat production (in pounds). 7.10 7.03 8.15 5.91 7.22 5.58 5.47 5.86 Use a calculator to verify that the sample variance for this plot is s? x 0.933. Test the claim that there is a difference (either way) in the population variance of wheat straw production for these two plots. Use a 5% level of signifcance. (a) What is the level of significance? State the null and alternate hypotheses. O H: 0, - 0,; H,: 0,2>0 (b) Find the value of the sample Fstatistic. (Use 2 decimal places.) What are the degrees of freedorm? df P Type here to search 75°F Mustly sunny A A - 4x 1103 AM
Two plots at Rothamsted Experimental Station were studied for production of wheat straw. For a random sumple of years, the annual wheat straw production (in pounds) from one plot was as follows. 6.40 7.03 7.17 6.96 7.31 7.18 7.06 5.79 6.24 5.91 6.14 Use a calculator to verify that, for this plot, the sample variance is sz 0.317. Another random sample of years for a second plot gave the following annual wheat production (in pounds). 7.10 7.03 8.15 5.91 7.22 5.58 5.47 5.86 Use a calculator to verify that the sample variance for this plot is s? x 0.933. Test the claim that there is a difference (either way) in the population variance of wheat straw production for these two plots. Use a 5% level of signifcance. (a) What is the level of significance? State the null and alternate hypotheses. O H: 0, - 0,; H,: 0,2>0 (b) Find the value of the sample Fstatistic. (Use 2 decimal places.) What are the degrees of freedorm? df P Type here to search 75°F Mustly sunny A A - 4x 1103 AM

MATLAB: An Introduction with Applications
6th Edition
ISBN:9781119256830
Author:Amos Gilat
Publisher:Amos Gilat
Chapter1: Starting With Matlab
Section: Chapter Questions
Problem 1P

Related questions

Question
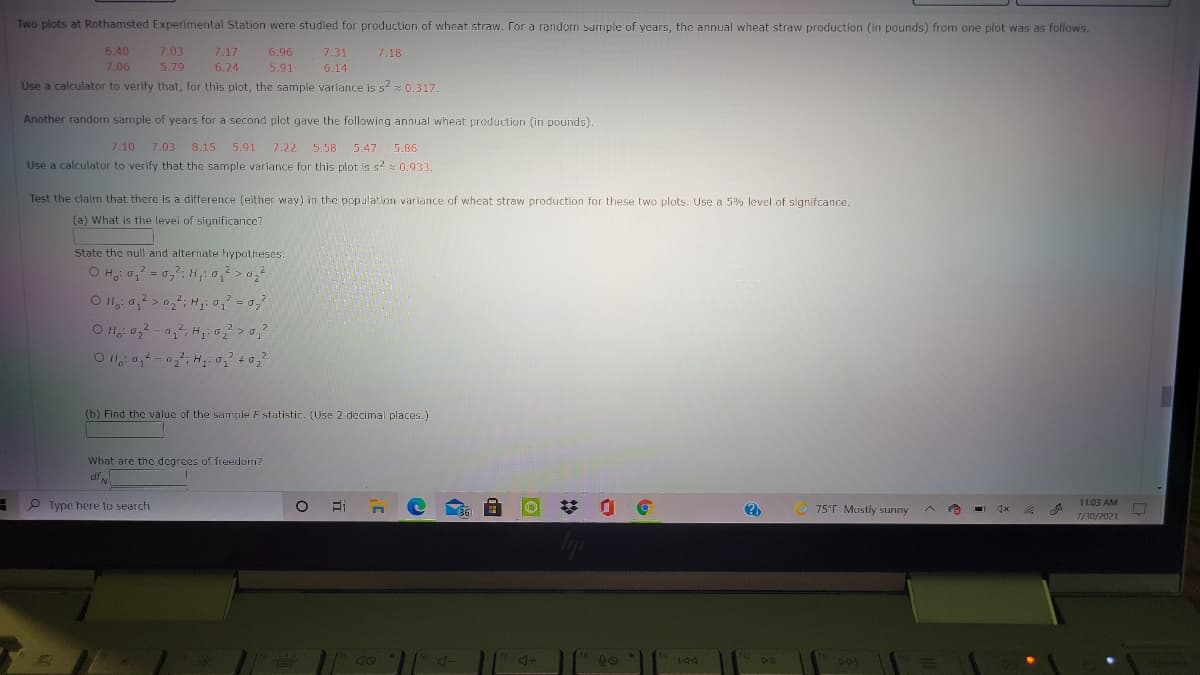
Transcribed Image Text:Two plots at Rothamsted Experimental Station were studied for production of wheat straw. For a random sumple of years, the annual wheat straw production (in pounds) from one plot was as follows.
6.40
7.03
7.17
6.96
7.31
7.18
7.06
5.79
6.24
5.91
6.14
Use a calculator to verify that, for this plot, the sample variance is s2 0.317.
Another random sample of years for a second plot gave the following annual wheat production (in pounds).
7.10 7.03 8.15 5.91
7.22 5.58
5.47 5.86
Use a calculator to verify that the sample variance for this plot is s2 : 0.933.
Test the claim that there is a difference (either way) in the population variance of wheat straw production for these two plots. Use a 5% level of signifcance.
(a) What is the level of significance?
State the null and alternate hypotheses.
2.
O H 0,-0,; Hi o0,
2.
(b) Find the value of the sample Fstutistic. (Use 2 decimal places.)
What are the degrees of freedom?
P Type here to search
36
75°F Mustly sunny
11:03 AM
1/30/2021
to
ho
4+
DII
201
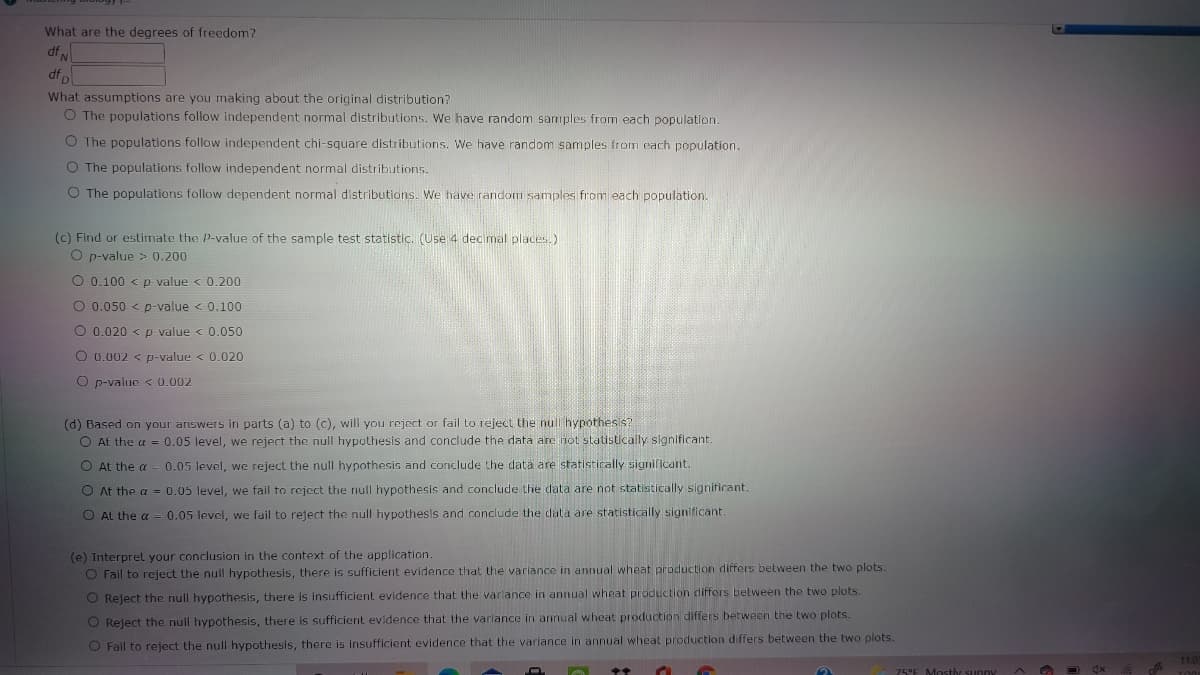
Transcribed Image Text:What are the degrees of freedom?
df N
df
What assumptions are you making about the original distribution?
O The populations follow independent normal distributions. We have random sarmples from each population.
O The populations follow independent chi-square distributions. We have random samples from cach population.
O The populations follow independent normal distributions.
O The populations follow dependent normal distributions. We have random samples from each population.
(c) Find or estimate the P-value of the sample test statistic. (Use 4 decimal places.)
O p-value > 0.200
O 0.100 < p value < 0.200
O 0.050 < p-value < 0.100
O 0.020 < p value < 0.050
O 0.002 < p-value < 0.020
O p-value < 0.002
(d) Based on your ariswers in parts (a) to (c), will you reject or fail to reject the null hypothes s?
O At the a = 0.05 level, we reject the null hypothesis and conclude the data are not statistically significant.
O At the a
0.05 level, we reject the null hypothesis and conclude the data are statistically significant.
O At the a - 0.05 level, we fail to reject the null hypothesis and conclude the data are not statistically significant.
O AL the a = 0.05 level, we fail to reject the null hypothesls and conclude the data are statistically significant
(e) Interpret your conclusion in the context of the application.
O Fail to reject the null hypothesis, there is sufficient evidence that the variance in annual wheat production differs between the two plots.
O Reject the null hypothesis, there is insufficient evidence that the varlance in annual wheat production differs belween the two plots.
O Reject the null hypothesis, there is sufficient evidence that the variance in annual wheat production differs between the two plots.
O Fail to reject the null hypothesis, there is insufficient evidence that the varlance in annual wheat production differs between the two plots.
75°E Mostly sunny
Expert Solution
This question has been solved!
Explore an expertly crafted, step-by-step solution for a thorough understanding of key concepts.

Step by step
Solved in 2 steps

Knowledge Booster


Learn more about
Need a deep-dive on the concept behind this application? Look no further. Learn more about this topic, statistics and related others by exploring similar questions and additional content below.Recommended textbooks for you
MATLAB: An Introduction with Applications
Statistics
ISBN:
9781119256830
Author:
Amos Gilat
Publisher:
John Wiley & Sons Inc

Probability and Statistics for Engineering and th…
Statistics
ISBN:
9781305251809
Author:
Jay L. Devore
Publisher:
Cengage Learning

Statistics for The Behavioral Sciences (MindTap C…
Statistics
ISBN:
9781305504912
Author:
Frederick J Gravetter, Larry B. Wallnau
Publisher:
Cengage Learning
MATLAB: An Introduction with Applications
Statistics
ISBN:
9781119256830
Author:
Amos Gilat
Publisher:
John Wiley & Sons Inc
Probability and Statistics for Engineering and th…
Statistics
ISBN:
9781305251809
Author:
Jay L. Devore
Publisher:
Cengage Learning
Statistics for The Behavioral Sciences (MindTap C…
Statistics
ISBN:
9781305504912
Author:
Frederick J Gravetter, Larry B. Wallnau
Publisher:
Cengage Learning

Elementary Statistics: Picturing the World (7th E…
Statistics
ISBN:
9780134683416
Author:
Ron Larson, Betsy Farber
Publisher:
PEARSON

The Basic Practice of Statistics
Statistics
ISBN:
9781319042578
Author:
David S. Moore, William I. Notz, Michael A. Fligner
Publisher:
W. H. Freeman

Introduction to the Practice of Statistics
Statistics
ISBN:
9781319013387
Author:
David S. Moore, George P. McCabe, Bruce A. Craig
Publisher:
W. H. Freeman