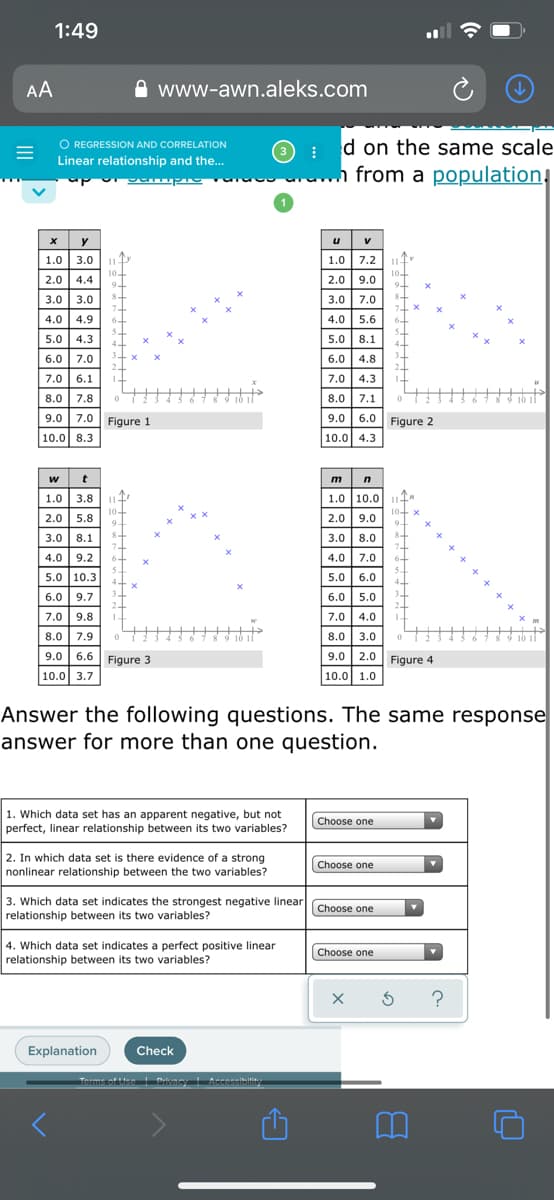
u 1.0 7.2 1 10 2.0 9.0 1.0 3.0 1 2.0 4.4 3.0 3.0 3.0 7.0 4.0 | 4.9 4.0 5.6 5.0 4.3 5.0 8.1 6.0 7.0 6.0 4.8 7.0 6.1 7.0 4.3 8.0 7.8 9.0 7.0 Figure 1 10.0 8.3 8.0 7.1 6.0 Figure 2 10.0 4.3 9.0 w m 1.0 3.8 2.0 5.8 1.0 10.0 14 10-x 2.0 9.0 3.0 8.1 3.0 8.0 4.0 9.2 4.0 | 7.0 5.0 10.3 5.0 6.0 6.0 9.7 6.0 5.0 7.0 9.8 7.0 4.0 8.0 3.0 9.0 2.0 Figure 4 10.0 1.0 8.0 7.9 9.0 6.6 Figure 3 10.0 3.7 Answer the following questions. The same response answer for more than one question. 1. Which data set has an apparent negative, but not perfect, linear relationship between its two variables? Choose one 2. In which data set is there evidence of a strong nonlinear relationship between the two variables? Choose one 3. Which data set indicates the strongest negative linear Choose one relationship between its two variables? 4. Which data set indicates a perfect positive linear relationship between its two variables? Choose one
u 1.0 7.2 1 10 2.0 9.0 1.0 3.0 1 2.0 4.4 3.0 3.0 3.0 7.0 4.0 | 4.9 4.0 5.6 5.0 4.3 5.0 8.1 6.0 7.0 6.0 4.8 7.0 6.1 7.0 4.3 8.0 7.8 9.0 7.0 Figure 1 10.0 8.3 8.0 7.1 6.0 Figure 2 10.0 4.3 9.0 w m 1.0 3.8 2.0 5.8 1.0 10.0 14 10-x 2.0 9.0 3.0 8.1 3.0 8.0 4.0 9.2 4.0 | 7.0 5.0 10.3 5.0 6.0 6.0 9.7 6.0 5.0 7.0 9.8 7.0 4.0 8.0 3.0 9.0 2.0 Figure 4 10.0 1.0 8.0 7.9 9.0 6.6 Figure 3 10.0 3.7 Answer the following questions. The same response answer for more than one question. 1. Which data set has an apparent negative, but not perfect, linear relationship between its two variables? Choose one 2. In which data set is there evidence of a strong nonlinear relationship between the two variables? Choose one 3. Which data set indicates the strongest negative linear Choose one relationship between its two variables? 4. Which data set indicates a perfect positive linear relationship between its two variables? Choose one

Glencoe Algebra 1, Student Edition, 9780079039897, 0079039898, 2018
18th Edition
ISBN:9780079039897
Author:Carter
Publisher:Carter
Chapter4: Equations Of Linear Functions
Section4.5: Correlation And Causation
Problem 24PFA

Related questions

Topic Video
Question
Transcribed Image Text:1:49
AA
O www-awn.aleks.com
: d on the same scale
from a population,
O REGRESSION AND CORRELATION
Linear relationship and the..
y
u
V
1.0 3.0
1.0 7.2
11
10
10
9-
84
2.0 | 4.4
2.0 9.0
3.0 | 3.0
3.0 | 7.0
4.0 4.9
4.0 5.6
6-
5.0 4.3
5.0 8.1
4.
4-
6.0 | 7.0
6.0 4.8
2.
7.0 | 6.1
7.0 4.3
8.0
7.8
8.0 | 7.1
9.0 |
7.0 Figure 1
9.0 6.0 Figure 2
10.0 8.3
10.0 4.3
t
mn
w
1.0 10.0 1
10- x
9-
1.0 3.8
11
2.0 | 5.8
10-
94
2.0 9.0
3.0 | 8.1
3.0 | 8.0
7
4.0 7.0
4.0 | 9.2
6-
5.
5.0 10.3
4.
5.0 6.0
4-
3
3
6.0
9.7
6.0 5.0
2.
7.0 | 9.8
7.0 | 4.0
8.0 | 7.9
8.0 3.0
9.0 2.0 Figure 4
|10.0 1.0
9.0 | 6.6
Figure 3
10.0 3.7
Answer the following questions. The same response
answer for more than one question.
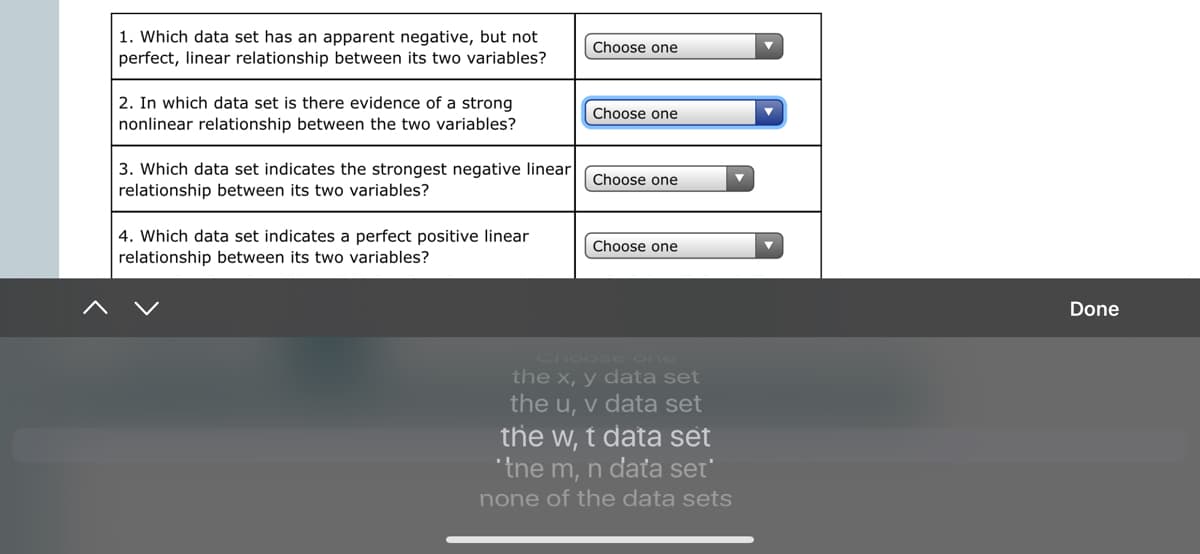
1. Which data set has an apparent negative, but not
perfect, linear relationship between its two variables?
Choose one
2. In which data set is there evidence of a strong
nonlinear relationship between the two variables?
Choose one
3. Which data set indicates the strongest negative linear
Choose one
relationship between its two variables?
4. Which data set indicates a perfect positive linear
relationship between its two variables?
Choose one
Explanation
Check
Terms of Use| Pivacy I
Accessibility
Transcribed Image Text:1. Which data set has an apparent negative, but not
perfect, linear relationship between its two variables?
Choose one
2. In which data set is there evidence of a strong
nonlinear relationship between the two variables?
Choose one
3. Which data set indicates the strongest negative linear
relationship between its two variables?
Choose one
4. Which data set indicates a perfect positive linear
Choose one
relationship between its two variables?
Done
Choose one
the x, y data set
the u, v data set
the w, t data set
"tne m, n daťa set'
none of the data sets
Expert Solution
This question has been solved!
Explore an expertly crafted, step-by-step solution for a thorough understanding of key concepts.

Step by step
Solved in 2 steps with 2 images

Knowledge Booster


Learn more about
Need a deep-dive on the concept behind this application? Look no further. Learn more about this topic, statistics and related others by exploring similar questions and additional content below.Recommended textbooks for you
Glencoe Algebra 1, Student Edition, 9780079039897…
Algebra
ISBN:
9780079039897
Author:
Carter
Publisher:
McGraw Hill
Glencoe Algebra 1, Student Edition, 9780079039897…
Algebra
ISBN:
9780079039897
Author:
Carter
Publisher:
McGraw Hill