
Microeconomics: Principles & Policy
14th Edition
ISBN:9781337794992
Author:William J. Baumol, Alan S. Blinder, John L. Solow
Publisher:William J. Baumol, Alan S. Blinder, John L. Solow
Chapter7: Production, Inputs, And Cost: Building Blocks For Supply Analysis
Section: Chapter Questions
Problem 9TY

Related questions
Question
Don’t know how to solve
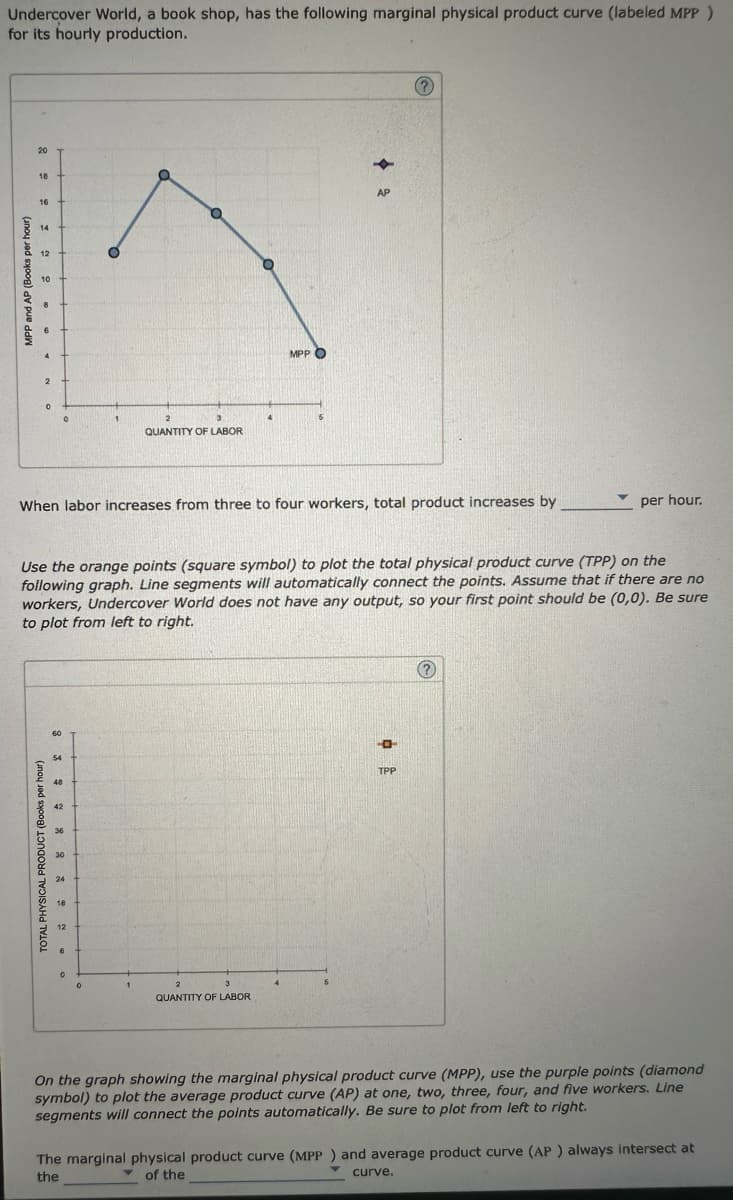
Transcribed Image Text:Undercover World, a book shop, has the following marginal physical product curve (labeled MPP )
for its hourly production.
P and AP (Books per hour)
20
18
16
14
12
10
8
2
0
TOTAL PHYSICAL PRODUCT (Books per hour)
0
60
When labor increases from three to four workers, total product increases by
54
48
Use the orange points (square symbol) to plot the total physical product curve (TPP) on the
following graph. Line segments will automatically connect the points. Assume that if there are no
workers, Undercover World does not have any output, so your first point should be (0,0). Be sure
to plot from left to right.
42
36
30
24
18
12
6
6
1
C
2
3
QUANTITY OF LABOR
0
MPP O
AP
3
QUANTITY OF LABOR
P
TPP
per hour.
(?)
On the graph showing the marginal physical product curve (MPP), use the purple points (diamond
symbol) to plot the average product curve (AP) at one, two, three, four, and five workers. Line
segments will connect the points automatically. Be sure to plot from left to right.
The marginal physical product curve (MPP) and average product curve (AP) always intersect at
of the
the
curve.
Expert Solution
This question has been solved!
Explore an expertly crafted, step-by-step solution for a thorough understanding of key concepts.

This is a popular solution!

Trending now
This is a popular solution!

Step by step
Solved in 2 steps with 3 images

Knowledge Booster


Learn more about
Need a deep-dive on the concept behind this application? Look no further. Learn more about this topic, economics and related others by exploring similar questions and additional content below.Recommended textbooks for you
Microeconomics: Principles & Policy
Economics
ISBN:
9781337794992
Author:
William J. Baumol, Alan S. Blinder, John L. Solow
Publisher:
Cengage Learning

Managerial Economics: Applications, Strategies an…
Economics
ISBN:
9781305506381
Author:
James R. McGuigan, R. Charles Moyer, Frederick H.deB. Harris
Publisher:
Cengage Learning

Microeconomics: Principles & Policy
Economics
ISBN:
9781337794992
Author:
William J. Baumol, Alan S. Blinder, John L. Solow
Publisher:
Cengage Learning
Managerial Economics: Applications, Strategies an…
Economics
ISBN:
9781305506381
Author:
James R. McGuigan, R. Charles Moyer, Frederick H.deB. Harris
Publisher:
Cengage Learning


Exploring Economics
Economics
ISBN:
9781544336329
Author:
Robert L. Sexton
Publisher:
SAGE Publications, Inc