Use the attached information to complete the ratio analysis. The Ratio Analysis is for Profitability.
Use the attached information to complete the ratio analysis. The Ratio Analysis is for Profitability.

Intermediate Financial Management (MindTap Course List)
13th Edition
ISBN:9781337395083
Author:Eugene F. Brigham, Phillip R. Daves
Publisher:Eugene F. Brigham, Phillip R. Daves
Chapter7: Analysis Of Financial Statements
Section: Chapter Questions
Problem 1Q: Define each of the following terms:
Liquidity ratios: current ratio; quick, or acid test,...

Related questions
Question
Use the attached information to complete the ratio analysis. The Ratio Analysis is for Profitability.
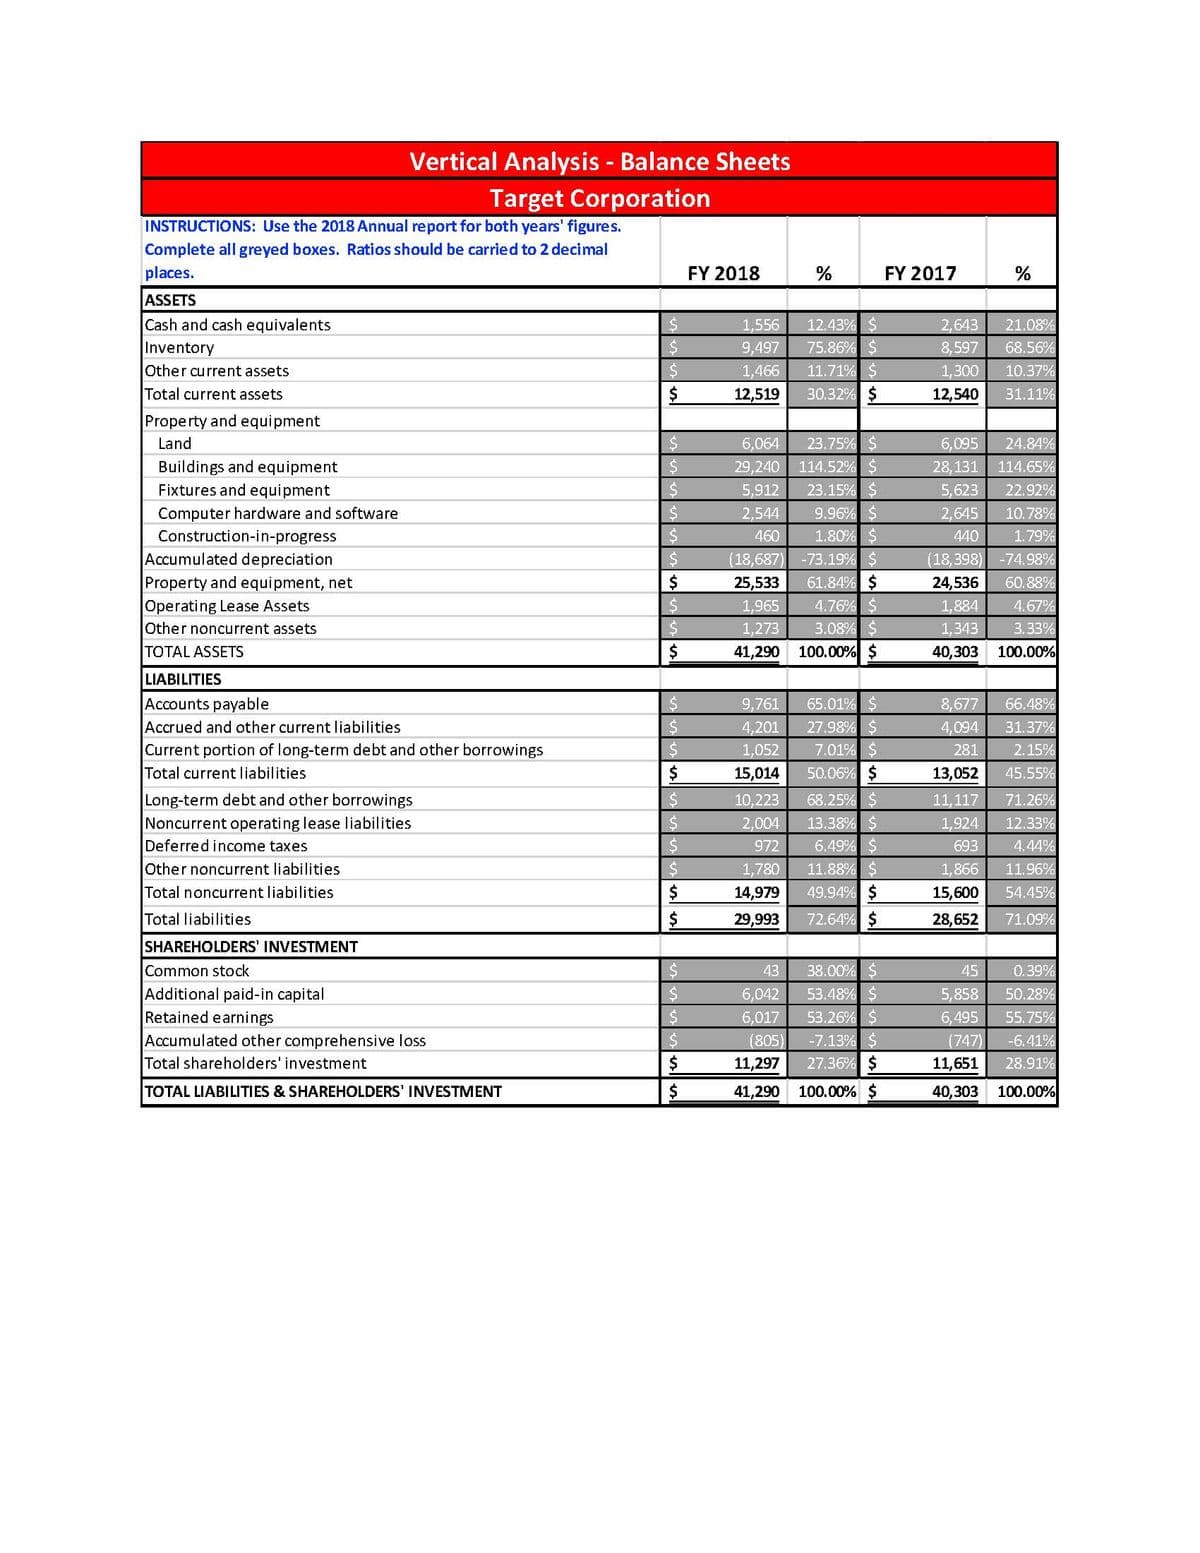
Transcribed Image Text:Vertical Analysis - Balance Sheets
Target Corporation
INSTRUCTIONS: Use the 2018 Annual report for both years' figures.
Complete all greyed boxes. Ratios should be carried to 2 decimal
places.
FY 2018
FY 2017
ASSETS
Cash and cash equivalents
12.43% $
75.86% $
1,556
2,643
21.08%
8,597
68.56%
Inventory
Other current assets
9,497
11.71% $
30.32% $
1,466
1,300
10.37%
Total current assets
12,519
12,540
31.11%
Property and equipment
Land
6,064
23.75% $
6,095
24.84%
29,240 114.52% $
23.15% $
9.96% $
1.80% $
-73.19% $
61.84% $
4.76% $
3.08% $
Buildings and equipment
28,131
114.65%
Fixtures and equipment
5,912
5,623
22.92%
Computer hardware and software
2,544
2,645
10.78%
Construction-in-progress
460
440
1.79%
Accumulated depreciation
Property and equipment, net
Operating Lease Assets
Other noncurrent assets
(18,687)
(18,398)
-74.98%
25,533
60.88%
24,536
1,884
1,965
4.67%
1,273
1,343
3.33%
TOTAL ASSETS
41,290
100.00% $
40,303 100.00%
LIABILITIES
Accounts payable
Accrued and other current liabilities
Current portion of long-term debt and other borrowings
Total current liabilities
65.01% $
27.98% $
7.01% $
50.06% $
8,677
66.48%
9,761
4,201
4,094
31.37%
1,052
281
2.15%
15,014
13,052
45.55%
Long-term debt and other borrowings
Noncurrent operating lease liabilities
Deferred income taxes
68.25% $
13.38% $
6.49% $
11.88% $
10,223
11,117
71.26%
2,004
1,924
12.33%
972
693
4.44%
Other noncurrent liabilities
1,780
1,866
11.96%
Total noncurrent liabilities
$4
14,979
49.94% $
15,600
54.45%
Total liabilities
29,993
72.64% $
28,652
71.09%
SHAREHOLDERS' INVESTMENT
38.00% $
53.48% $
53.26% $
Common stock
43
45
0.39%
Additional paid-in capital
Retained earnings
Accumulated other comprehensive loss
Total shareholders' investment
6,042
5,858
50.28%
6,017
6,495
55.75%
-7.13% $
27.36% $
(805)
(747)
-6.41%
11,297
11,651
28.91%
TOTAL LIABILITIES & SHAREHOLDERS' INVESTMENT
$
41,290
100.00% $
40,303
100.00%
%24
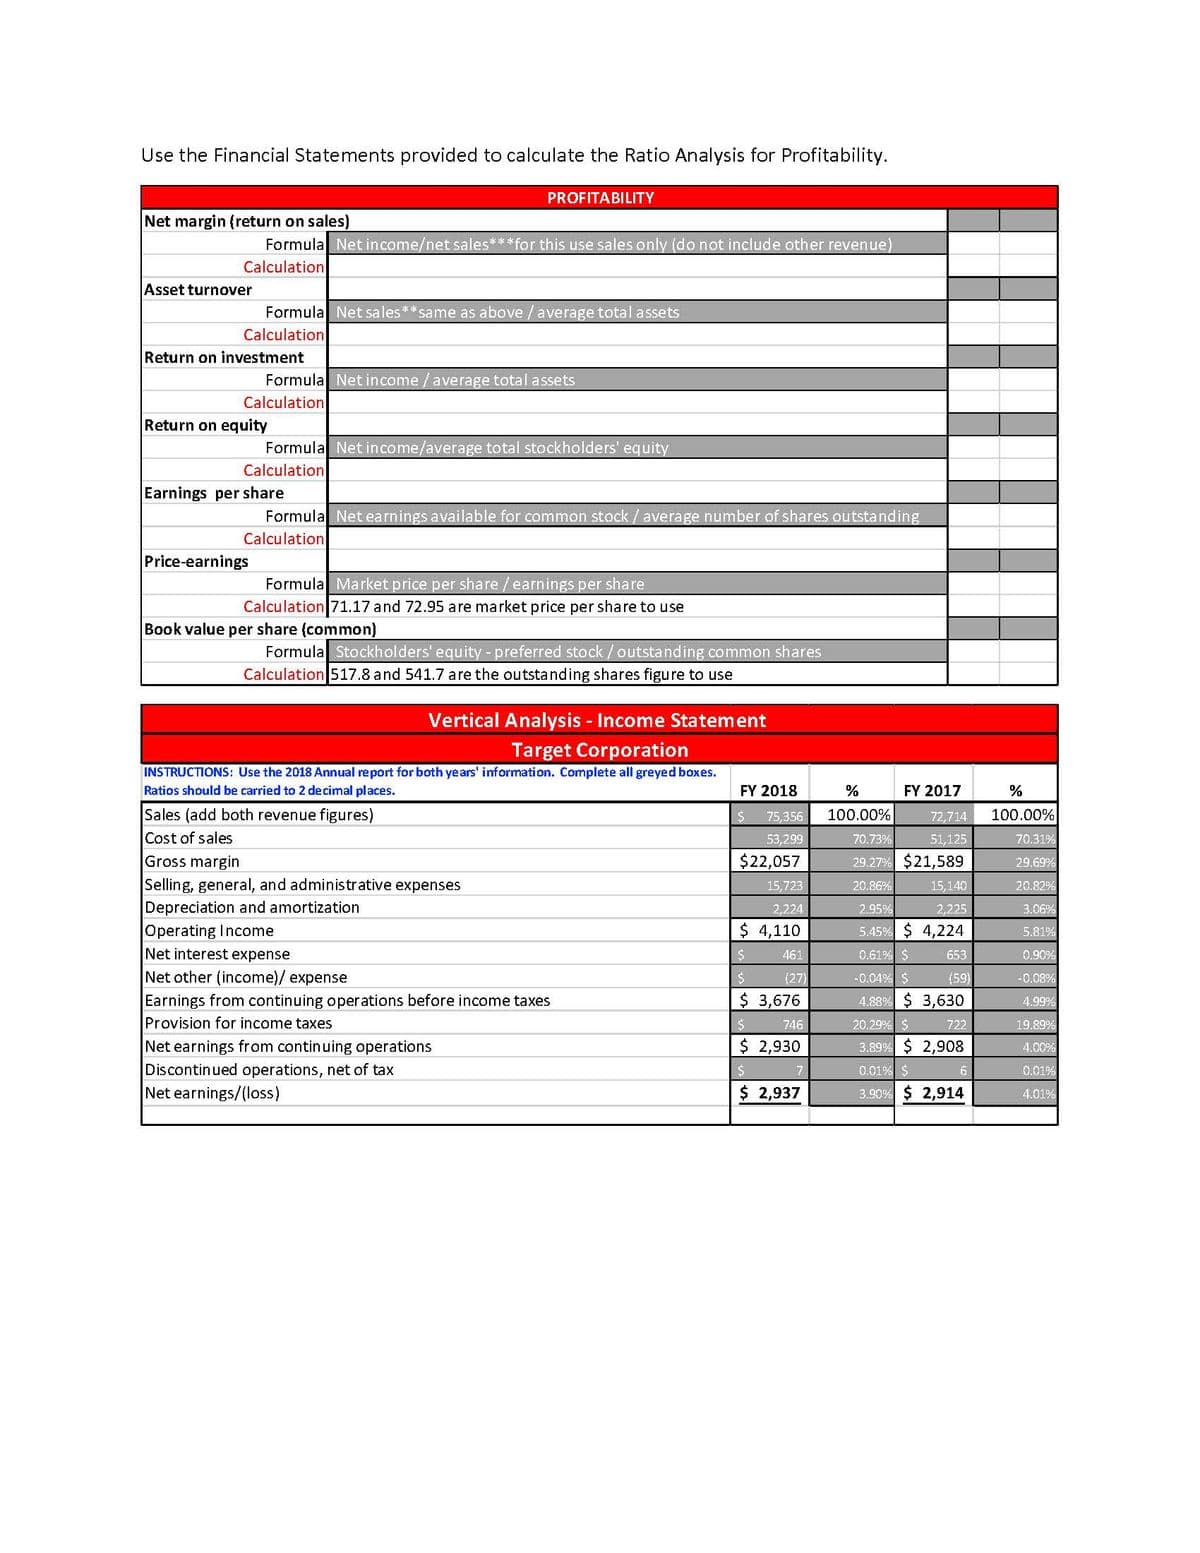
Transcribed Image Text:Use the Financial Statements provided to calculate the Ratio Analysis for Profitability.
PROFITABILITY
Net margin (return on sales)
Formula Net income/net sales***for this use sales only (do not include other revenue)
Calculation
Asset turnover
Formula Net sales**same as above /average total assets
Calculation
Return on investment
Formula Net income /average total assets
Calculation
Return on equity
Formula Net income/average total stockholders' equity
Calculation
Earnings per share
Formula Net earnings available for common stock /average number of shares outstanding
Calculation
Price-earnings
Formula Market price per share /earnings per share
Calculation 71.17 and 72.95 are market price per share to use
Book value per share (common)
Formula Stockholders' equity - preferred stock/outstanding common shares
Calculation 517.8 and 541.7 are the outstanding shares figure to use
Vertical Analysis - Income Statement
Target Corporation
INSTRUCTIONS: Use the 2018 Annual report for both years' information. Complete all greyed boxes.
Ratios should be carried to 2 de cimal places.
FY 2018
%
FY 2017
%
Sales (add both revenue figures)
24
75,356
100.00%
72,714
100.00%
Cost of sales
Gross margin
Selling, general, and administrative expenses
Depreciation and amortization
Operating Income
Net interest expense
Net other (income)/ expense
Earnings from continuing operations before income taxes
Provision for income taxes
53,299
70.73%
51,125
70.31%
$22,057
29.27% $21,589
29.69%
15,723
20.86%
20.82%
15,140
2,224
2.95%
2,225
3.06%
$ 4,110
5.45% $ 4,224
5.81%
461
0.61% $
653
0.90%
(27)
-0.04% $
(59)
-0.08%
$ 3,676
4.88% $ 3,630
4.99%
746
20.29% $
722
19.89%
$ 2,930
Net earnings from continuing operations
Discontinued operations, net of tax
Net earnings/(loss)
3.89%
2,908
4.00%
0.01% $
6
0.01%
$ 2,937
3.90% $ 2,914
4.01%
Expert Solution
This question has been solved!
Explore an expertly crafted, step-by-step solution for a thorough understanding of key concepts.

This is a popular solution!

Trending now
This is a popular solution!

Step by step
Solved in 2 steps with 1 images

Knowledge Booster


Learn more about
Need a deep-dive on the concept behind this application? Look no further. Learn more about this topic, accounting and related others by exploring similar questions and additional content below.Recommended textbooks for you
Intermediate Financial Management (MindTap Course…
Finance
ISBN:
9781337395083
Author:
Eugene F. Brigham, Phillip R. Daves
Publisher:
Cengage Learning

Financial Accounting
Accounting
ISBN:
9781337272124
Author:
Carl Warren, James M. Reeve, Jonathan Duchac
Publisher:
Cengage Learning

Intermediate Financial Management (MindTap Course…
Finance
ISBN:
9781337395083
Author:
Eugene F. Brigham, Phillip R. Daves
Publisher:
Cengage Learning
Financial Accounting
Accounting
ISBN:
9781337272124
Author:
Carl Warren, James M. Reeve, Jonathan Duchac
Publisher:
Cengage Learning

Managerial Accounting
Accounting
ISBN:
9781337912020
Author:
Carl Warren, Ph.d. Cma William B. Tayler
Publisher:
South-Western College Pub

Managerial Accounting: The Cornerstone of Busines…
Accounting
ISBN:
9781337115773
Author:
Maryanne M. Mowen, Don R. Hansen, Dan L. Heitger
Publisher:
Cengage Learning
Century 21 Accounting Multicolumn Journal
Accounting
ISBN:
9781337679503
Author:
Gilbertson
Publisher:
Cengage