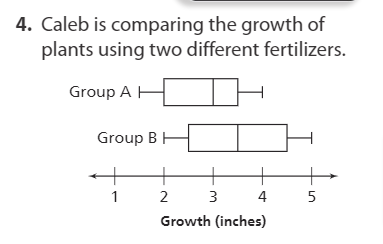
Use the box plots to make an inference using the variability of the data.


Unitary Method
The word “unitary” comes from the word “unit”, which means a single and complete entity. In this method, we find the value of a unit product from the given number of products, and then we solve for the other number of products.
Speed, Time, and Distance
Imagine you and 3 of your friends are planning to go to the playground at 6 in the evening. Your house is one mile away from the playground and one of your friends named Jim must start at 5 pm to reach the playground by walk. The other two friends are 3 miles away.
Profit and Loss
The amount earned or lost on the sale of one or more items is referred to as the profit or loss on that item.
Units and Measurements
Measurements and comparisons are the foundation of science and engineering. We, therefore, need rules that tell us how things are measured and compared. For these measurements and comparisons, we perform certain experiments, and we will need the experiments to set up the devices.
dear bartleby, i answered one of the questions to the answers you couldn't do, uh but thank you for replying back to me tho, i still need help with this you guys put answer come as fast as 30 mins and i failed my hw because i depended on you guys. but its ok. i was wondering if you can help me one last time. i posted the question and the question i reallly need answered.

Step by step
Solved in 2 steps


