Use the central limit theorem to find the mean and standard error of the mean of the indicated sampling distribution. Then sketch a graph of the sampling distribution. The per capita consumption of red meat by people in a country in a recent year was normally distributed, with a mean of 117 pounds and a standard deviation of 39.4 pounds. Random samples of size 15 are drawn from this population and the mean of each sample is determined. 4-0 0 = (Round to three decimal places as needed.) Sketch a graph of the sampling distribution. Choose the correct graph below. O A. A 96.7 117 137.3 Q O B. A 340.8 10.2 361.2 Q Q ww ^ A -106.8 10.2 127.2 86.5 117 147.5 O C. O D. Q
Use the central limit theorem to find the mean and standard error of the mean of the indicated sampling distribution. Then sketch a graph of the sampling distribution. The per capita consumption of red meat by people in a country in a recent year was normally distributed, with a mean of 117 pounds and a standard deviation of 39.4 pounds. Random samples of size 15 are drawn from this population and the mean of each sample is determined. 4-0 0 = (Round to three decimal places as needed.) Sketch a graph of the sampling distribution. Choose the correct graph below. O A. A 96.7 117 137.3 Q O B. A 340.8 10.2 361.2 Q Q ww ^ A -106.8 10.2 127.2 86.5 117 147.5 O C. O D. Q

Glencoe Algebra 1, Student Edition, 9780079039897, 0079039898, 2018
18th Edition
ISBN:9780079039897
Author:Carter
Publisher:Carter
Chapter10: Statistics
Section10.3: Measures Of Spread
Problem 26PFA

Related questions
Question
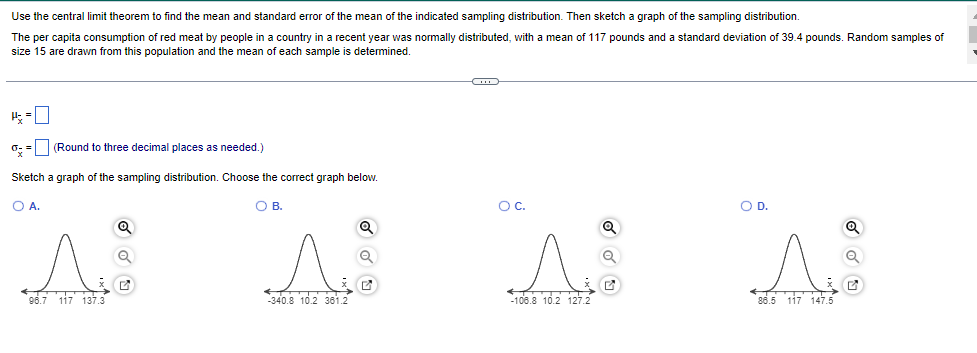
Transcribed Image Text:Use the central limit theorem to find the mean and standard error of the mean of the indicated sampling distribution. Then sketch a graph of the sampling distribution.
The per capita consumption of red meat by people in a country in a recent year was normally distributed, with a mean of 117 pounds and a standard deviation of 39.4 pounds. Random samples of
size 15 are drawn from this population and the mean of each sample is determined.
4-0
0 = (Round to three decimal places as needed.)
Sketch a graph of the sampling distribution. Choose the correct graph below.
O A.
A
96.7 117 137.3
Q
O B.
A
340.8 10.2 361.2
Q
Q
ww
^ A
-106.8 10.2 127.2
86.5 117 147.5
O C.
O D.
Q
Expert Solution
This question has been solved!
Explore an expertly crafted, step-by-step solution for a thorough understanding of key concepts.

This is a popular solution!

Trending now
This is a popular solution!

Step by step
Solved in 4 steps with 13 images

Recommended textbooks for you
Glencoe Algebra 1, Student Edition, 9780079039897…
Algebra
ISBN:
9780079039897
Author:
Carter
Publisher:
McGraw Hill
Glencoe Algebra 1, Student Edition, 9780079039897…
Algebra
ISBN:
9780079039897
Author:
Carter
Publisher:
McGraw Hill