Use the data in the table below to complete parts (a) through (d). 35 21 39 23 0 20 70 Q X y Click the icon to view details on how to construct and interpret residual plots. 40 26 0 20 O B. 47 32 100, 42 29 34 *** 49 30 0 20 62 30 C. 70 (c) Construct a residual plot. Plot the x-values on the horizontal axis and the residuals on the vertical axis. Choose the correct graph below. OA. T 55 25 52 28 0 20 O D. 34
Use the data in the table below to complete parts (a) through (d). 35 21 39 23 0 20 70 Q X y Click the icon to view details on how to construct and interpret residual plots. 40 26 0 20 O B. 47 32 100, 42 29 34 *** 49 30 0 20 62 30 C. 70 (c) Construct a residual plot. Plot the x-values on the horizontal axis and the residuals on the vertical axis. Choose the correct graph below. OA. T 55 25 52 28 0 20 O D. 34

Glencoe Algebra 1, Student Edition, 9780079039897, 0079039898, 2018
18th Edition
ISBN:9780079039897
Author:Carter
Publisher:Carter
Chapter4: Equations Of Linear Functions
Section4.6: Regression And Median-fit Lines
Problem 1CYU

Related questions
Question
Use the data in the table below to complete.
X 39, 35, 40, 47, 42, 49, 62, 55, 52
y
Transcribed Image Text:0 20
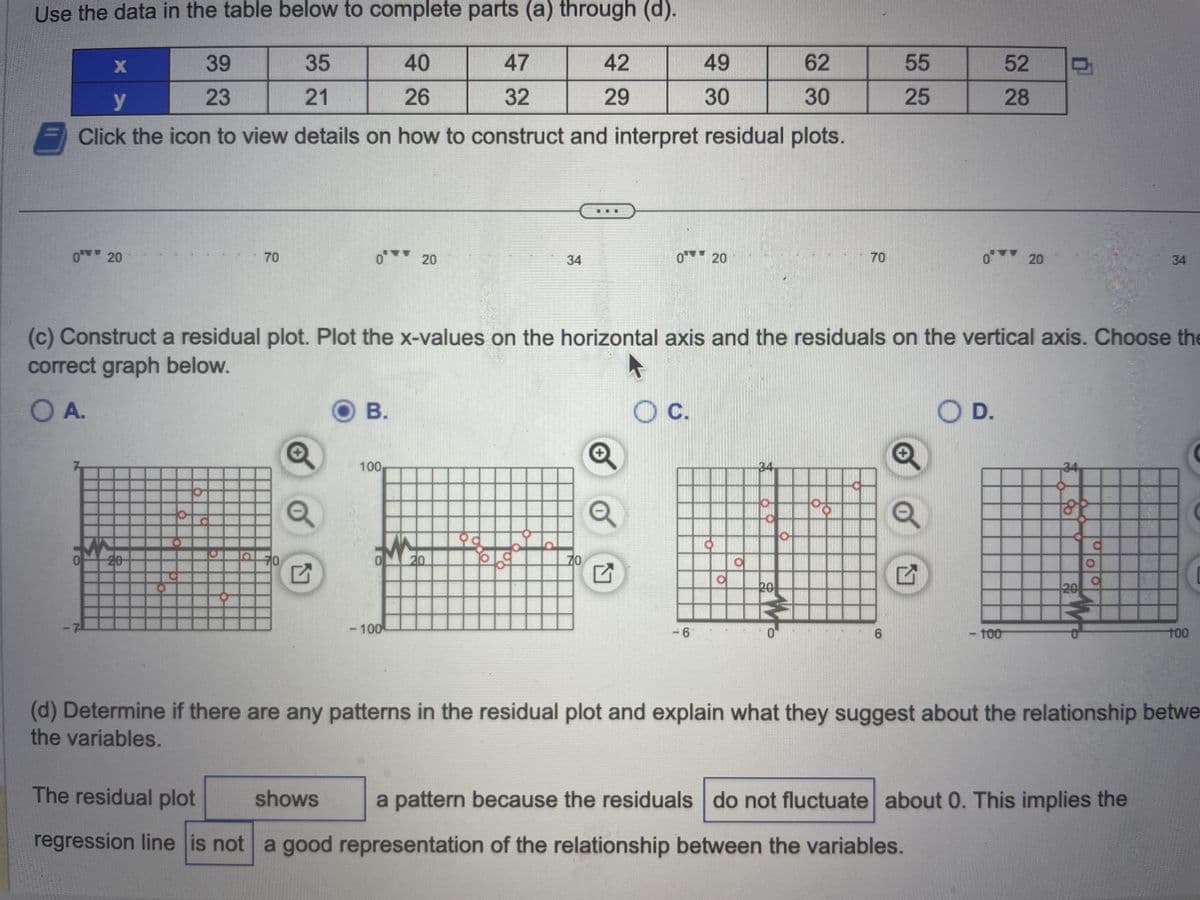
Use the data in the table below to complete parts (a) through (d).
X
39
35
40
47
62
y
23
21
26
32
30
E Click the icon to view details on how to construct and interpret residual plots.
70
70
0 20
Q
O B.
100,
OML20
- 100
99
42
29
34
200
(c) Construct a residual plot. Plot the x-values on the horizontal axis and the residuals on the vertical axis. Choose the
correct graph below.
A.
49
30
Q
0 20
O C.
C
34
70
20
55
25
6
Ⓒ
0
다
O D.
52
28
-100
20
0
34
20
O
a
100
(d) Determine if there are any patterns in the residual plot and explain what they suggest about the relationship betwe
the variables.
The residual plot
shows
a pattern because the residuals do not fluctuate about 0. This implies the
regression line is not a good representation of the relationship between the variables.
Expert Solution
This question has been solved!
Explore an expertly crafted, step-by-step solution for a thorough understanding of key concepts.

This is a popular solution!

Trending now
This is a popular solution!

Step by step
Solved in 6 steps with 6 images

Recommended textbooks for you
Glencoe Algebra 1, Student Edition, 9780079039897…
Algebra
ISBN:
9780079039897
Author:
Carter
Publisher:
McGraw Hill

Big Ideas Math A Bridge To Success Algebra 1: Stu…
Algebra
ISBN:
9781680331141
Author:
HOUGHTON MIFFLIN HARCOURT
Publisher:
Houghton Mifflin Harcourt

Functions and Change: A Modeling Approach to Coll…
Algebra
ISBN:
9781337111348
Author:
Bruce Crauder, Benny Evans, Alan Noell
Publisher:
Cengage Learning
Glencoe Algebra 1, Student Edition, 9780079039897…
Algebra
ISBN:
9780079039897
Author:
Carter
Publisher:
McGraw Hill
Big Ideas Math A Bridge To Success Algebra 1: Stu…
Algebra
ISBN:
9781680331141
Author:
HOUGHTON MIFFLIN HARCOURT
Publisher:
Houghton Mifflin Harcourt
Functions and Change: A Modeling Approach to Coll…
Algebra
ISBN:
9781337111348
Author:
Bruce Crauder, Benny Evans, Alan Noell
Publisher:
Cengage Learning

Algebra & Trigonometry with Analytic Geometry
Algebra
ISBN:
9781133382119
Author:
Swokowski
Publisher:
Cengage


Trigonometry (MindTap Course List)
Trigonometry
ISBN:
9781337278461
Author:
Ron Larson
Publisher:
Cengage Learning