Use the line graph to answer the following questions. A. Identify the percentage of baby boomers who identified as Independents in 2014. B. Describe a trend in the data. C. Explain how that trend might affect political campaigns in the future. D. Explain how political parties should adapt based on the data shown in the line graph.
Use the line graph to answer the following questions. A. Identify the percentage of baby boomers who identified as Independents in 2014. B. Describe a trend in the data. C. Explain how that trend might affect political campaigns in the future. D. Explain how political parties should adapt based on the data shown in the line graph.

Chapter4: Linear Functions
Section4.3: Fitting Linear Models To Data
Problem 22SE: The U.S. Census tracks the percentage of persons 25 years or older who are college graduates. That...

Related questions

Question
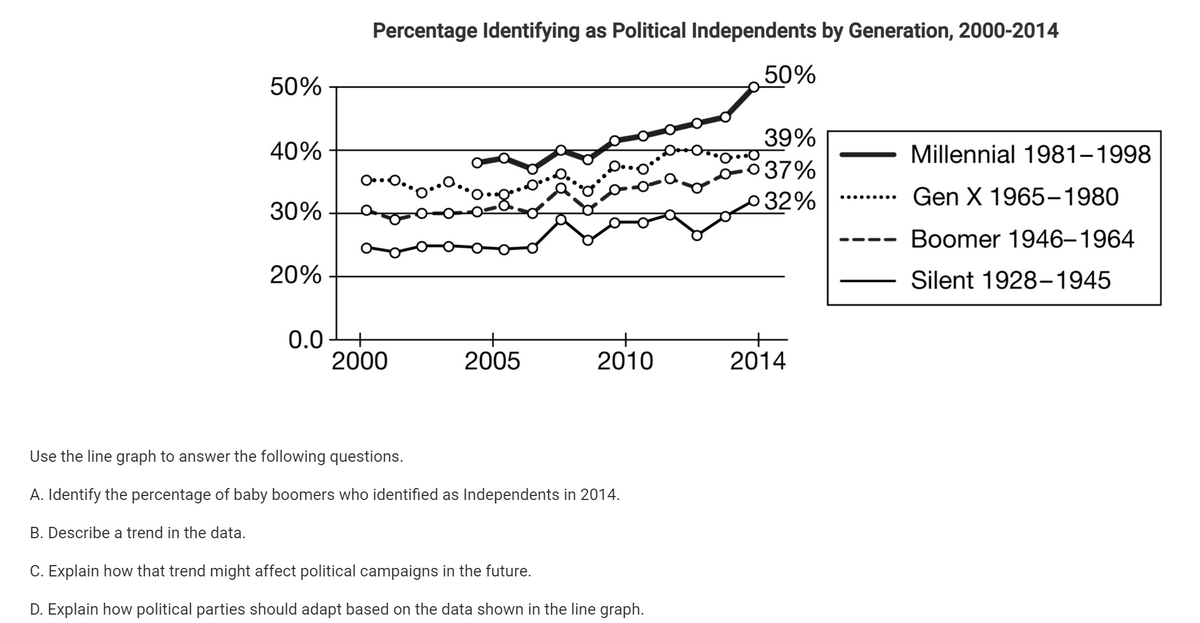
Transcribed Image Text:Percentage Identifying as Political Independents by Generation, 2000-2014
50%
50%
39%
37%
40%
Millennial 1981–1998
32%
Gen X 1965-1980
30%
Boomer 1946–1964
20%
Silent 1928-1945
0.0
2000
+
2005
2010
2014
Use the line graph to answer the following questions.
A. Identify the percentage of baby boomers who identified as Independents in 2014.
B. Describe a trend in the data.
C. Explain how that trend might affect political campaigns in the future.
D. Explain how political parties should adapt based on the data shown in the line graph.
Expert Solution
This question has been solved!
Explore an expertly crafted, step-by-step solution for a thorough understanding of key concepts.

This is a popular solution!

Trending now
This is a popular solution!

Step by step
Solved in 2 steps

Knowledge Booster


Learn more about
Need a deep-dive on the concept behind this application? Look no further. Learn more about this topic, statistics and related others by exploring similar questions and additional content below.Recommended textbooks for you

Glencoe Algebra 1, Student Edition, 9780079039897…
Algebra
ISBN:
9780079039897
Author:
Carter
Publisher:
McGraw Hill

Big Ideas Math A Bridge To Success Algebra 1: Stu…
Algebra
ISBN:
9781680331141
Author:
HOUGHTON MIFFLIN HARCOURT
Publisher:
Houghton Mifflin Harcourt
Glencoe Algebra 1, Student Edition, 9780079039897…
Algebra
ISBN:
9780079039897
Author:
Carter
Publisher:
McGraw Hill
Big Ideas Math A Bridge To Success Algebra 1: Stu…
Algebra
ISBN:
9781680331141
Author:
HOUGHTON MIFFLIN HARCOURT
Publisher:
Houghton Mifflin Harcourt