Use the model to predict the year that corresponds to retails sales of $246 billion. 17
Use the model to predict the year that corresponds to retails sales of $246 billion. 17

Functions and Change: A Modeling Approach to College Algebra (MindTap Course List)
6th Edition
ISBN:9781337111348
Author:Bruce Crauder, Benny Evans, Alan Noell
Publisher:Bruce Crauder, Benny Evans, Alan Noell
Chapter5: A Survey Of Other Common Functions
Section5.6: Higher-degree Polynomials And Rational Functions
Problem 1TU: The following fictitious table shows kryptonite price, in dollar per gram, t years after 2006. t=...

Related questions
Topic Video
Question
I need help with the one in red please
Transcribed Image Text:09:067
A myopenmath.com
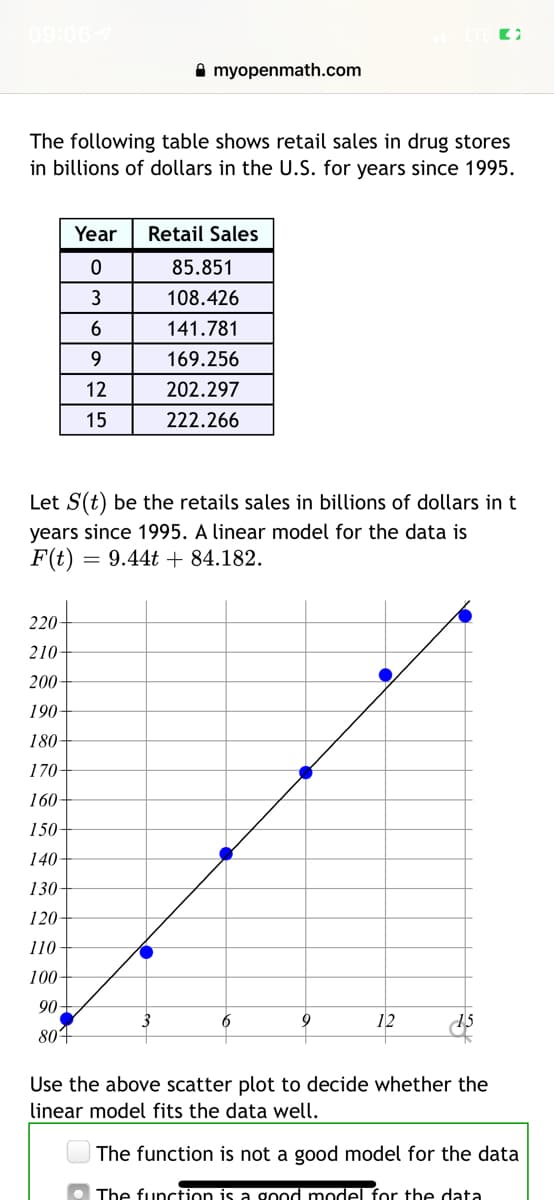
The following table shows retail sales in drug stores
in billions of dollars in the U.S. for years since 1995.
Year
Retail Sales
85.851
108.426
6
141.781
9.
169.256
12
202.297
15
222.266
Let S(t) be the retails sales in billions of dollars in t
years since 1995. A linear model for the data is
F(t)
9.44t + 84.182.
220-
210-
200
190-
180
170-
160-
150
140-
130
120-
110
100-
90-
6
12
804
Use the above scatter plot to decide whether the
linear model fits the data well.
The function is not a good model for the data
The function is a god model for the data
Transcribed Image Text:09:06 7
Done
A myopenmath.com
AA
190-
180-
170
160
150-
140-
130
120-
110
100-
90
3
6
9
12
804
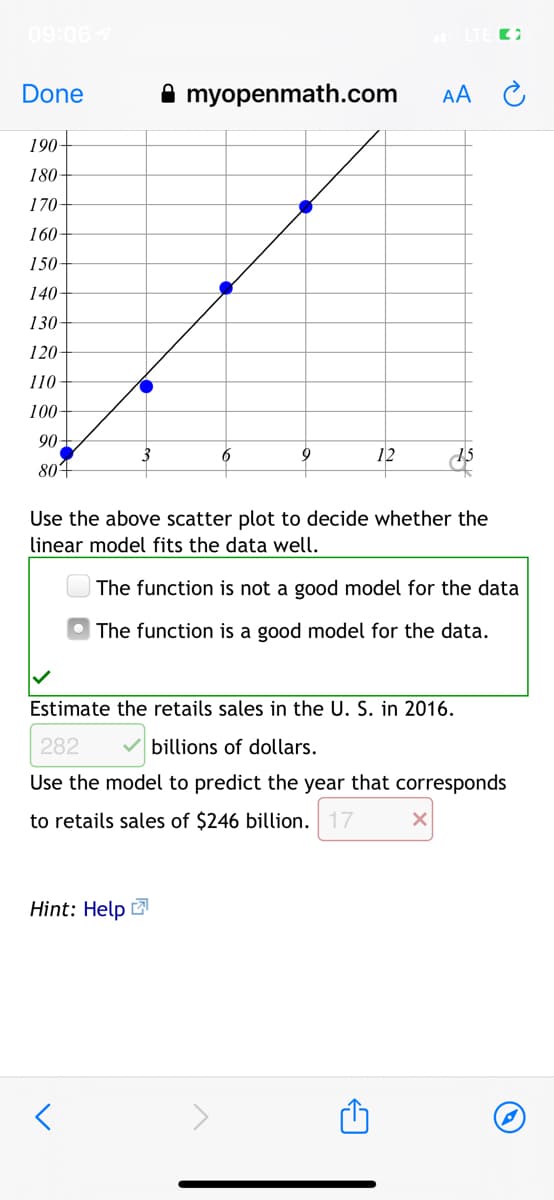
Use the above scatter plot to decide whether the
linear model fits the data well.
The function is not a good model for the data
The function is a good model for the data.
Estimate the retails sales in the U. S. in 2016.
282
billions of dollars.
Use the model to predict the year that corresponds
to retails sales of $246 billion. 17
Hint: Help
Expert Solution
This question has been solved!
Explore an expertly crafted, step-by-step solution for a thorough understanding of key concepts.

This is a popular solution!

Trending now
This is a popular solution!

Step by step
Solved in 2 steps

Knowledge Booster


Learn more about
Need a deep-dive on the concept behind this application? Look no further. Learn more about this topic, statistics and related others by exploring similar questions and additional content below.Recommended textbooks for you
Functions and Change: A Modeling Approach to Coll…
Algebra
ISBN:
9781337111348
Author:
Bruce Crauder, Benny Evans, Alan Noell
Publisher:
Cengage Learning
Functions and Change: A Modeling Approach to Coll…
Algebra
ISBN:
9781337111348
Author:
Bruce Crauder, Benny Evans, Alan Noell
Publisher:
Cengage Learning